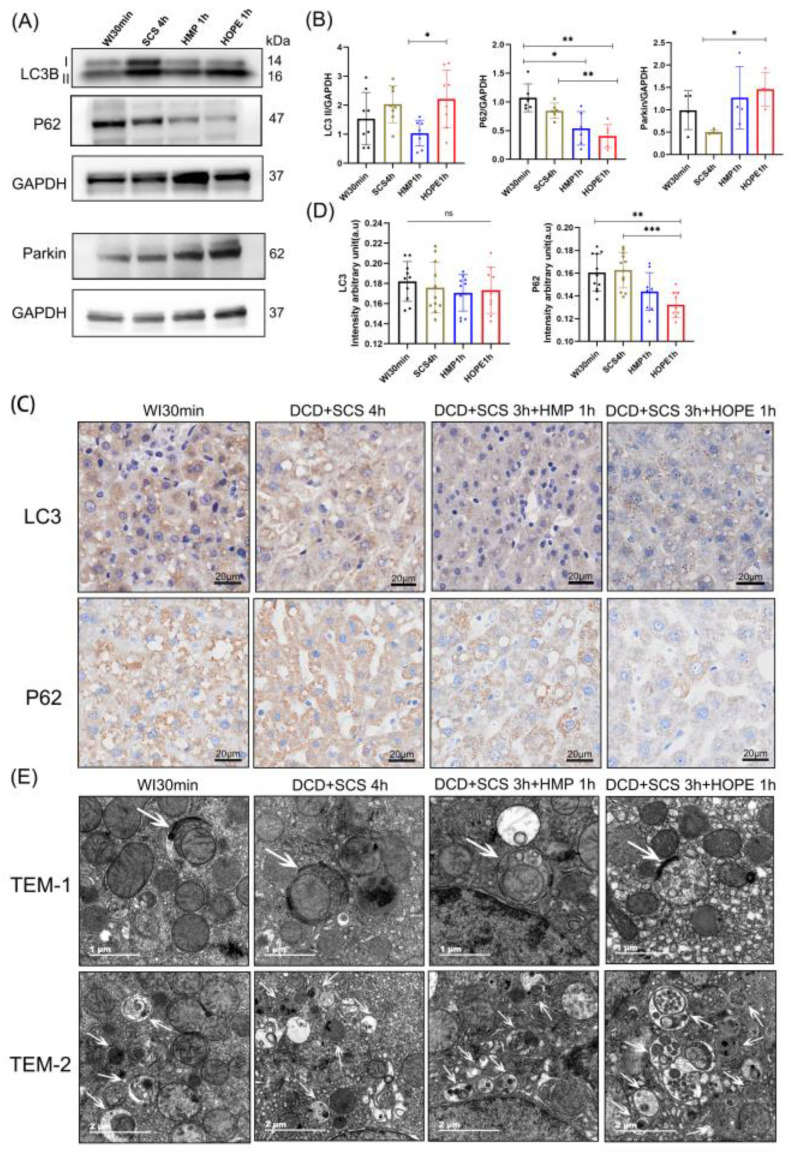
Figure 5.
HOPE promoted mitophagy flux in DCD liver. (A) Western blot shows the mitophagy related protein levels; (B) the quantitative analysis of the relative intensity of LC3-II, P62, and Parkin normalized to the GAPDH loading control; (C) IHC staining of LC3 and P62 was performed on the paraffin-embedded section of rat liver tissues. Scale bar: 20 μm; (D) IHC-stained LC3 and P62 were quantified using Image J. (E) Electron micrographs of live tissue in four groups. White arrowheads in TEM-1: mitophagy vacuoles. White arrowheads in TEM-2: autophagy vacuoles. (n = 3 independent experiments for (A,C,E)). Mean ± SD, N.S., p > 0.05, * p < 0.05, ** p < 0.01, *** p < 0.001.

