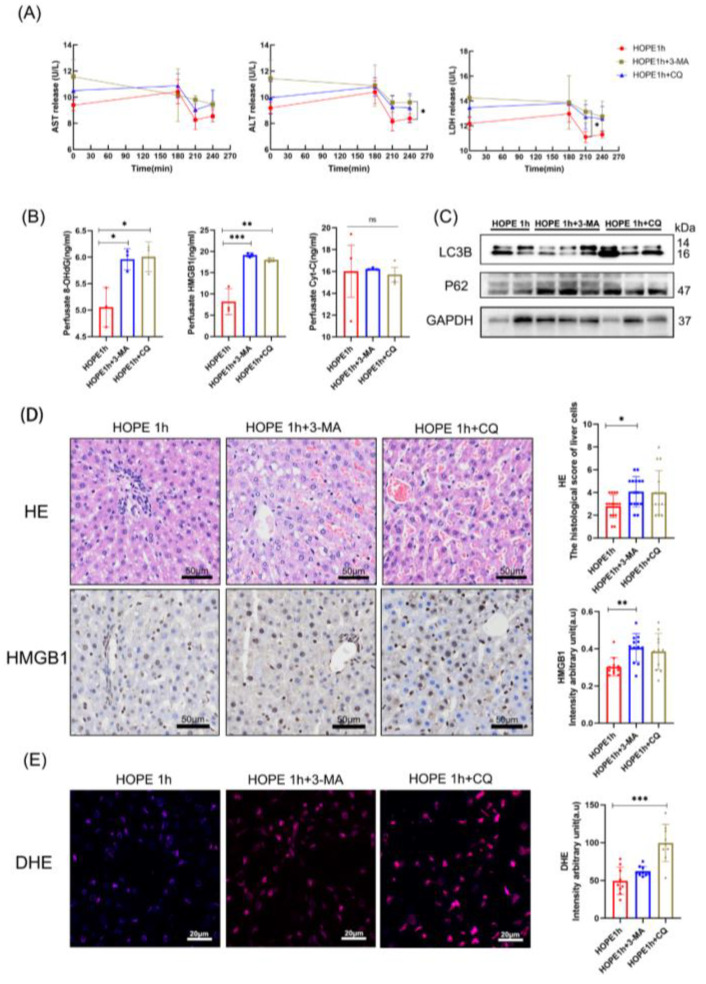
Figure 6.
Autophagy inhibition attenuated the protective effect on DCD liver with HOPE 1 h. (A) The perfusate ALT, AST, and LDH data were transformed to a log2 scale. (B) 8-OHdG, HMGB1, and Cyt C in perfusate. (C) Western blot shows the autophagy-related protein levels. (D) H&E staining, scale bar: 50 μm; IHC staining of HMGB1, scale bar: 50 μm; histological scores were analyzed based on Suzuki’s criteria, and IHC-stained cells was quantified using Image J. (E) DHE staining was quantified using Image J, scale bar: 20 μm. (n = 3 independent experiments). Mean ± SD, N.S., p > 0.05, * p < 0.05, ** p < 0.01, *** p < 0.001.

