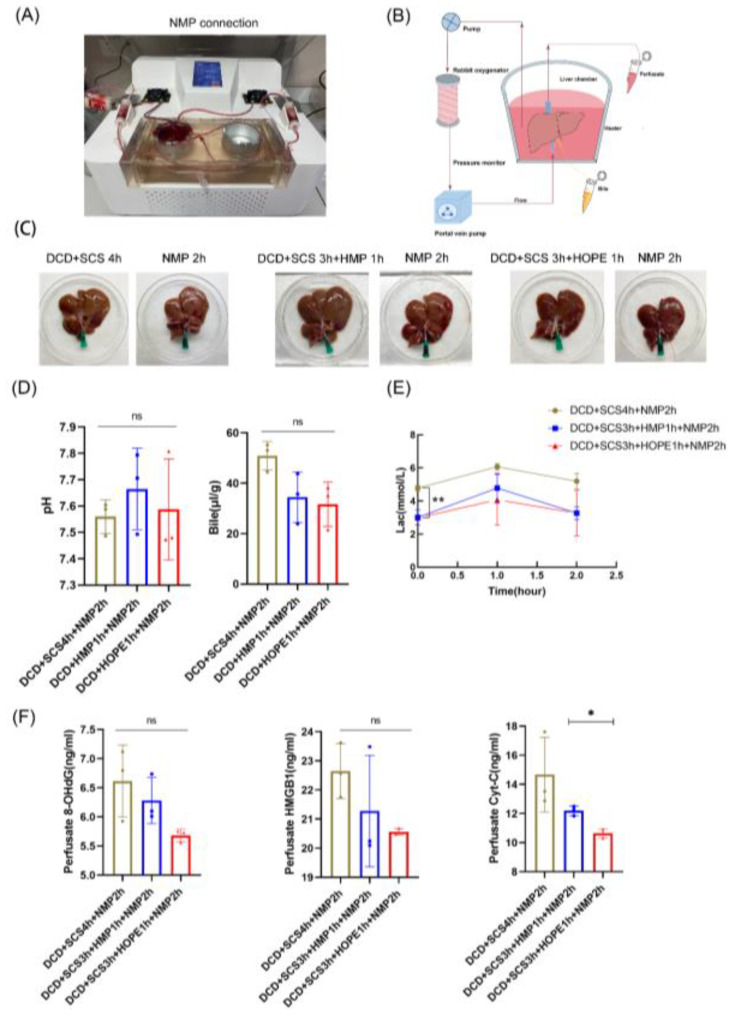
Figure 7.
NMP following the hyperthymic storage/perfusion (n = 3). (A) NMP connection system. (B) Schematic representation of NMP devices. (C) liver appearance using three different hyperthymic storage or MP methods in perfusion series 2. (D) Bile pH and production. (E) Lactate concentration during NMP. (F) ELISA kit of 8-OHdG, Cyt C, and HMGB1 in perfusate (n = 3 independent experiments for C–F). Mean ± SD, N.S., p > 0.05, * p < 0.05, ** p < 0.01.

