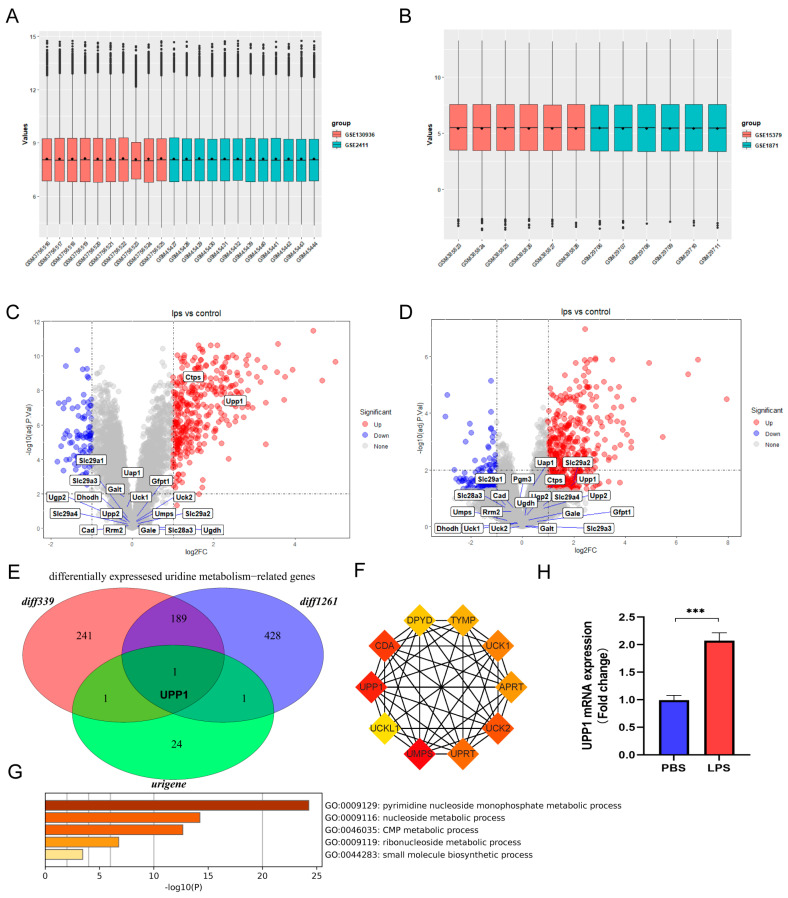
Figure 1.
Identification and validation of dysregulated uridine metabolism in lung tissues of sepsis-induced ALI mice. (A) Gene expression level of the integrated datasets with same platform GPL339 after removing batch effects. (B) Gene expression level of the integrated datasets with same platform GPL1261 after removing batch effects. (C) The volcano plot of the differentially expressed genes between sepsis and control group in the integrated dataset of the same platform GPL339 and annotated with uridine metabolism-related genes. (D) The volcano plot of the differentially expressed genes between sepsis and control group in the integrated dataset of the same platform GPL1261 annotated with uridine metabolism-related genes. (E) Venn diagram of the differentially expressed genes in the integrated datasets in same GPL339 and same GPL1261 and uridine metabolism-related genes. The red circle and blue circle represent the differentially expressed genes in GPL339 and GPL1261, annotated diff339 and diff1261, respectively. The green circle means uridine metabolism-related genes, annotated urigene. (F) The PPI network shows the top 10 interacted protein of uridine phosphorylase 1 (UPP1). Each box represents one protein and the darker the color is, the more inseparable the interaction with other proteins are. (G) The UPP1 mRNA level of lung tissues between sepsis-induced ALI and control group. (H) Relative mRNA levels of IL6, TNFα and IL1β in lung tissue in the indicated group. n = 6 mice per group. (Data are presented as Mean ± SD, *** p < 0.001 compared with indicated group).

