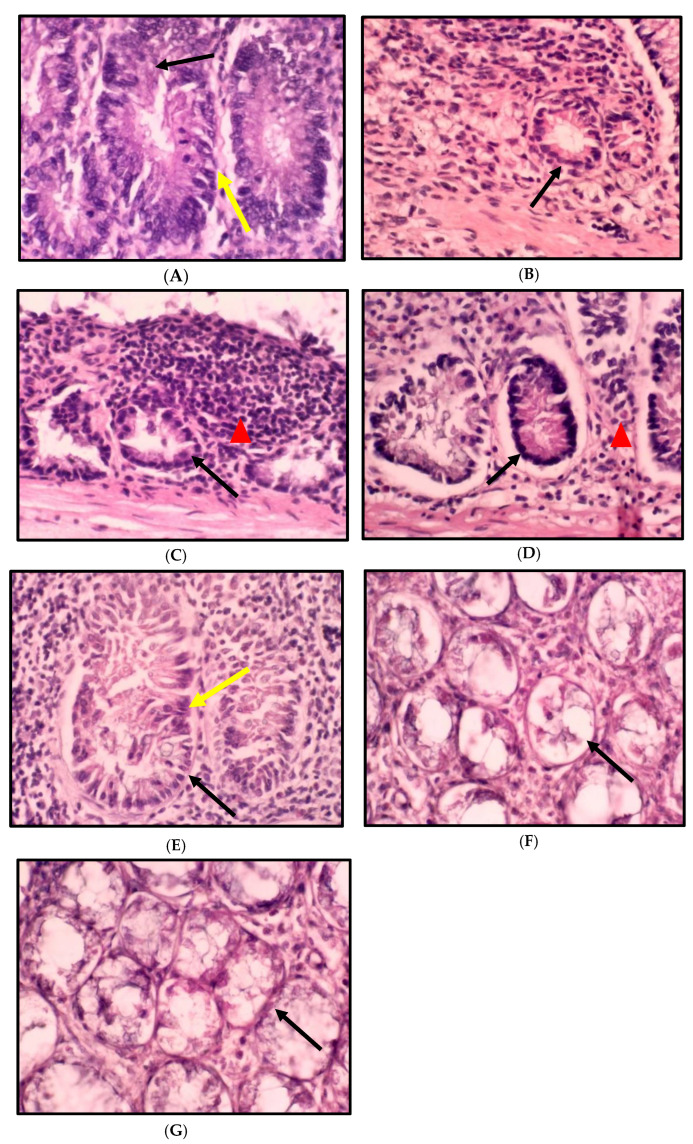
Figure 3.
Cross-section of the rat colon stained with haematoxylin and eosin: (A) NC, normal diet + DMH; (B) H, high-fat diet; (C) HC, high-fat diet + DMH; (D) HCF, high-fat diet + DMH + 5-FU; (E) HCAP125, high-fat diet + DMH + 125 mg/kg A. paniculata ethanol extract; (F) HCAP250, high-fat diet + DMH + 250 mg/kg A. paniculata ethanol extract; (G) HCAP500, high-fat diet + DMH + 500 mg/kg A. paniculata ethanol extract. (Magnification, ×10.) For (A–E), the black arrow indicates aberrant crypt; the yellow arrow indicates larger, stratified, depolarized nuclei. Mucin and goblet cells diminish. Expanded crypts with slightly elongated nuclei are found in (E). (F,G) show a typical crypt without crowding, stratification, or mucin depletion. The red triangle indicates inflammatory cells in (C,D).

