. 2023 Mar 17;12:e82584. doi: 10.7554/eLife.82584

Figure 2. Prefusion conformation for wild-type (WT) spike (S) protein favored by 3 hr incubation at 37℃.

(A) Relative fractional uptake (Dex = 10 min) for unincubated WT S mapped onto an S trimer structure with three ‘down’ RBDs (PDB ID: 6VXX) (coverage of WT S constructs shown in Figure 2—figure supplements 12, differences in deuterium exchange for WT 2P and 6P constructs shown in Figure 2—figure supplement 3). Deuterium exchange heat map gradient of white (0%) -red (70%) as mapped on S structure (PDB ID: 6VXX). (B) Differences in deuterium exchange (Δ RFU) (Dex = 10 min) for WT S after a 3 hr incubation at 37℃ minus unincubated WT S were mapped onto the S structure (PDB ID: 6VXX). Shades of blue correspond to negative differences in deuterium exchange and shades of red correspond to a positive difference in deuterium exchange. (C–E) Stacked mass spectra for WT S peptides 553–568, 899–913, and 988–998 with undeuterated reference spectra, 1 min and 10 min exchange (left to right). For each peptide, the top row shows spectra for unincubated WT S and the bottom row shows spectra for WT S incubated for 3 hr at 37°C. Absolute intensities are indicated at the top right of each spectrum. (F) Differences in deuterium exchange (deuterons) mapped at peptide resolution from N to C terminus for WT S incubated for 3 hr at 37°C minus unincubated WT S are shown in difference plots for 1-, 2-, and 10 min exchange. Select peptides showing significant differences in exchange are annotated. Significance was determined by hybrid significance testing (p<0.01, Figure 2—figure supplement 4). Differences are tabulated in Figure 2—source data 1 with corresponding peptide numbers* shown on the x-axis of the difference plot.

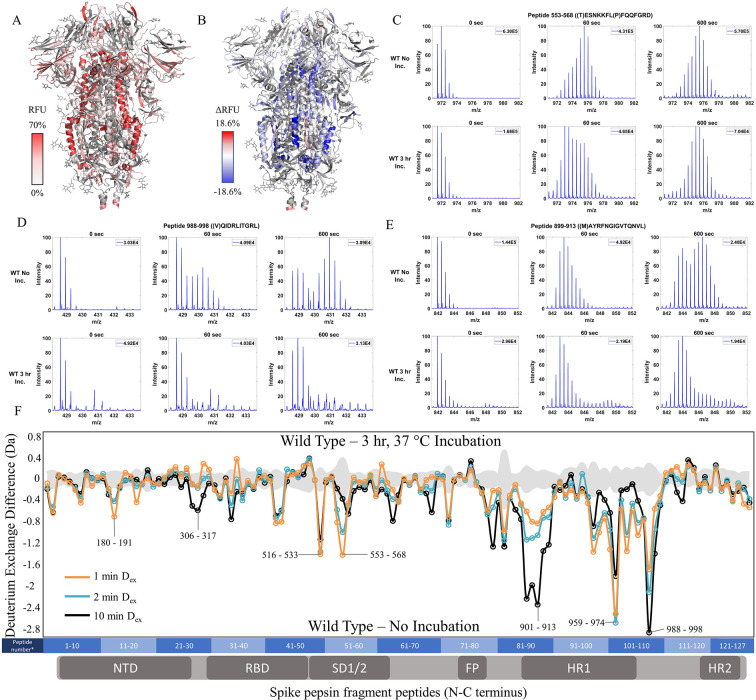
Figure 2—source data 1. Deuterium uptake differences for Incubated WT S minus unincubated WT S.
Figure 2—source data 2. Deuterium uptake differences for WT 6P S minus WT 2P S.
Figure 2—source data 3. Source data for the volcano plot; Figure 2, Figure 2—figure supplement 2.
Figure 2—source data 4. Source data for the volcano plot; Figure 2, Figure 2—figure supplement 4.

Figure 2.

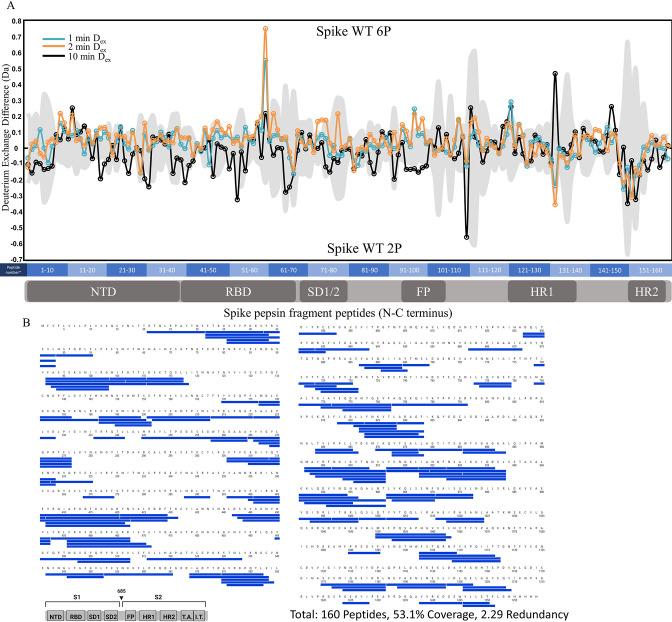
Figure 2—figure supplement 1. Comparative HDXMS of wild-type (WT) spike (S) protein 2P and 6P.

Figure 2—figure supplement 1.

(A) Difference plot of WT 6P S minus WT 2P S for peptides N to C terminus. Differences for 1, 2, and 10 min exchange are shown in blue, orange, and black, respectively. The gray trace denotes standard errors of deuterium exchange for each peptide. (B) Coverage map of WT 2P S compared to 6P S using the WT 2P sequence showing 160 peptides spanning 53.1% of the S. The domain organization of S is indicated.
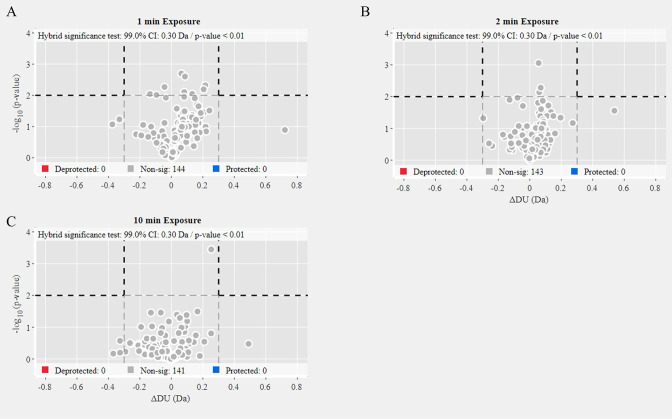
Figure 2—figure supplement 2. Volcano plot analysis of wild-type (WT) 2P versus 6P S.

Figure 2—figure supplement 2.

Volcano plots for 1 min (A), 2 min (B), and 10 min (C) exchange (Figure 2—source data 3). Significantly protected (blue) or deprotected (red) peptides were identified using a hybrid significance test and a p-value <0.01.
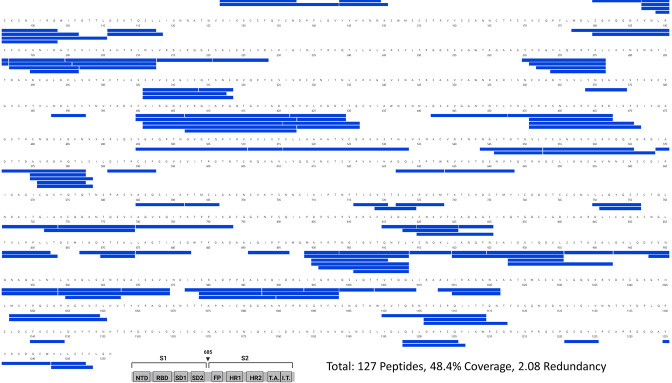
Figure 2—figure supplement 3. Primary sequence coverage map of pepsin fragment peptides for wild-type (WT) spike (S) protein incubated at 37℃ versus unincubated WT S.

Figure 2—figure supplement 3.

Coverage map of WT S incubated at 37℃ compared to unincubated WT S using the WT 2P sequence showing 127 peptides spanning 48.4% of the S. The domain organization of S is shown.
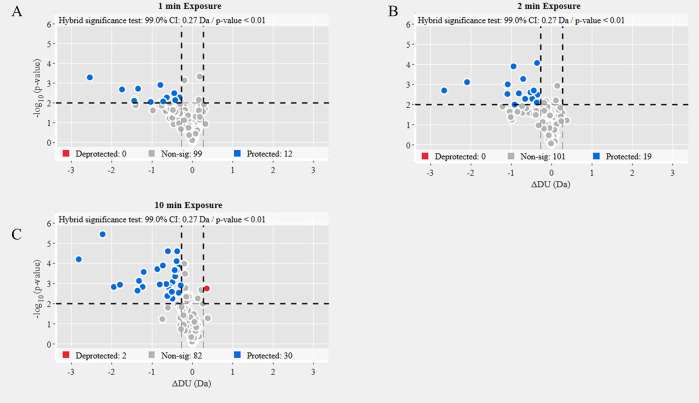
Figure 2—figure supplement 4. Volcano plot analysis of wild-type (WT) spike (S) protein 37℃ versus WT S unincubated.

Figure 2—figure supplement 4.

Volcano plots for 1 min (A), 2 min (B), and 10 min (C) exchange (Figure 2—source data 4). Significantly protected (blue) or deprotected (red) peptides were identified using a hybrid significance test and a p-value <0.01.
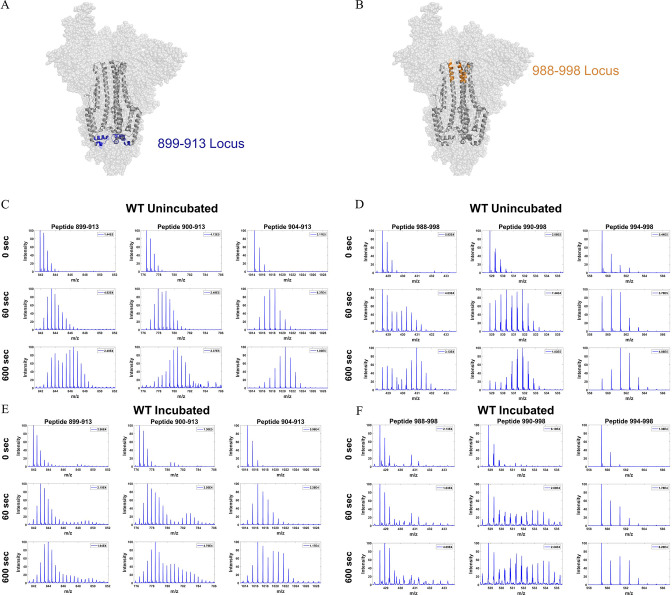
Figure 2—figure supplement 5. Deuterium exchanged spectral envelopes for overlapping peptides from two stalk loci in wild-type (WT) spike (S) protein.

Figure 2—figure supplement 5.

(A) Peptide locus 899–913 (blue) mapped onto the WT S structure (PDB ID: 7TGX). (B) Peptide locus 988–998 (orange) mapped onto WT S structure (PDB ID: 7TGX). (C) Spectra from three overlapping peptides in the 899–913 locus of unincubated WT S. Reference state as well as spectra for 1 and 10 min exchange are shown from top to bottom for each peptide. (D) Spectra from three overlapping peptides in the 988–998 locus of unincubated WT S. Reference state as well as spectra for 1 and 10 min exchange are shown from top to bottom for each peptide. (E) Spectra from three overlapping peptides in the 899–913 locus of incubated WT S. Reference state as well as spectra for 1 and 10 min exchange (only the first replicate) are shown from top to bottom for each peptide. (F) Spectra from three overlapping peptides in the 988–998 locus of incubated WT S. Reference state as well as spectra for 1 and 10 min exchange (only the first replicate) are shown from top to bottom for each peptide. Absolute intensities are indicated at the top right of each spectrum.
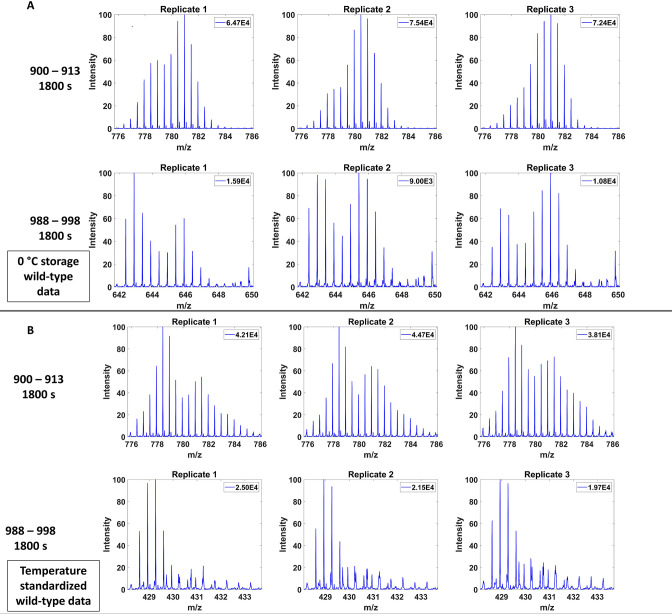
Figure 2—figure supplement 6. Effect of ~0℃ storage in the course of automated hydrogen deuterium exchange mass spectrometry (HDXMS) on wild-type (WT) trimer peptides.

Figure 2—figure supplement 6.

(A) Effect of 0°C storage during automated HDXMS analysis on peptides 900–913 (top) and 988–998 (bottom). Spectra shown for 1800s exchange and three replicates are shown with a 4 hr storage at 0℃ storage between each replicate. (B) Spectra shown for 1800s exchange and peptides 900–913 (top) and 988–998 (bottom) for samples that were not stored at 0℃ between replicates. Absolute intensity shown in top right of each spectra.
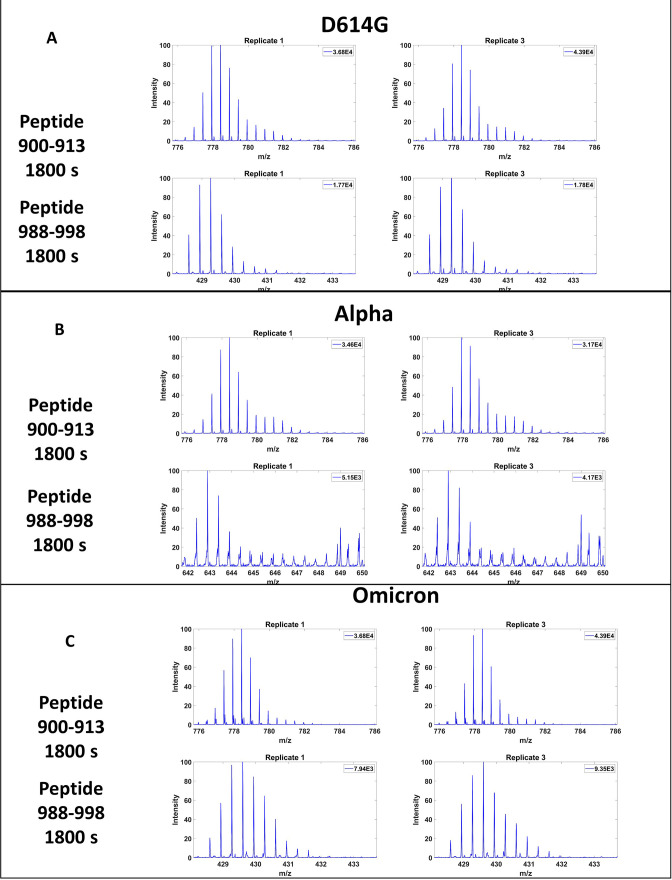
Figure 2—figure supplement 7. Effect of ~0℃ storage in the course of automated hydrogen deuterium exchange mass spectrometry (HDXMS) on deuterium exchange at variant spike (S) protein trimer locus peptides.

Figure 2—figure supplement 7.

Effect of 0℃ storage in between technical replicates during automated HDXMS analysis on peptides 900–913 (top) and 988–998 (bottom) at 1800s of deuterium exchange for (A) D614G, (B) Alpha, (C) Omicron. Spectra shown for the first and third replicates with 8 hr storage at 0℃ between replicates. Data for delta were collected over multiple days and, therefore, did not undergo 0℃ storage in between replicates.