. 2023 Mar 17;12:e82584. doi: 10.7554/eLife.82584

Figure 7. Increased trimer stability and altered N-terminal domain (NTD) dynamics correlate with the timeline of emergence.

(A) Trimer stalk peptides 900–913 (blue), 990–998 (orange), and 1013–1021 (red) mapped onto a wild-type (WT) spike (S) protein structure (PDB ID: 7TGX) (helical wheel analysis of stalk peptides shown in Figure 7—figure supplement 1). (B) Protection in trimer stalk peptides in S variants compared to D614G S plotted as protection per amino acid versus date of emergence at Dex = 1 min. (C) NTD and RBD peptides showing increased dynamics in the timeline of variant emergence mapped onto a 1 RBD ‘up’ WT S structure (PDB ID: 7TGX). Peptides 177–191, 245–265, and 456–467 are shown in purple, cyan, and green, respectively. (D) Changes in deuterium uptake for NTD and receptor-binding domain (RBD) peptides in variant S compared to D614G S at Dex = 30 min are plotted as a change in deuterium uptake versus date of emergence (additional plots in Figure 7—figure supplement 2). Uptake plots for representative peptides in all variants are shown in Figure 7—figure supplement 3.

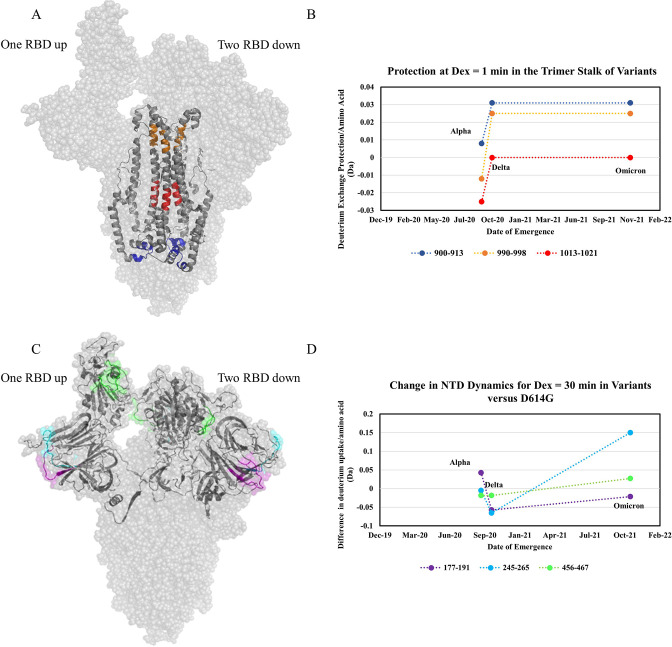
Figure 7.

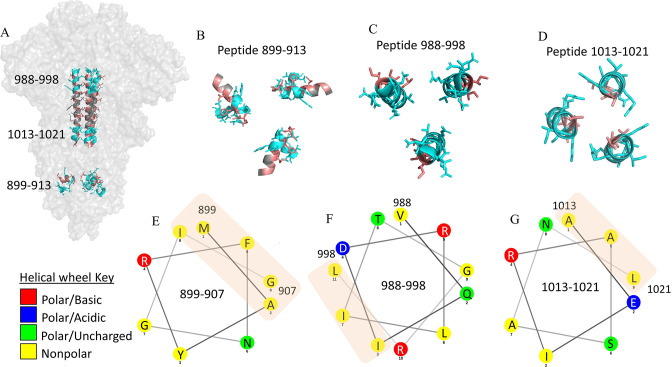
Figure 7—figure supplement 1. Hydrophobic interactions maintain trimer core at stalk region.

Figure 7—figure supplement 1.

Hydrophobic interactions maintain trimer core at the stalk region (A) Structure of the spike (S) protein trimer highlighting stalk region in salmon (PDB ID: 6VXX). Selected hydrogen deuterium exchange mass spectrometry (HDXMS) analysis peptides at the top, middle and bottom of the trimer stalk are colored cyan. (B, C, D) Cross-sectional view of peptides in the S trimer stalk are colored cyan. Hydrophobic residues are colored salmon. (E, F, G) Helical wheel representation of peptides classifying residues based on polarity. Hydrophobic patches are shown by orange rectangle.
Figure 7—figure supplement 2. Plot of protection in spike (S) protein trimer stalk peptides as function of timeline of emergence.

Figure 7—figure supplement 2.

Protection for each peptide was determined by subtracting deuterium uptake for each variant from wild-type (WT) and normalizing to the number of exchangeable amino acids. Protection is plotted against months after the first identification of SARS-CoV-2 in Dec. 2019 and curves fit to a one phase association (Graphpad Prism 3.0, San Diego CA).
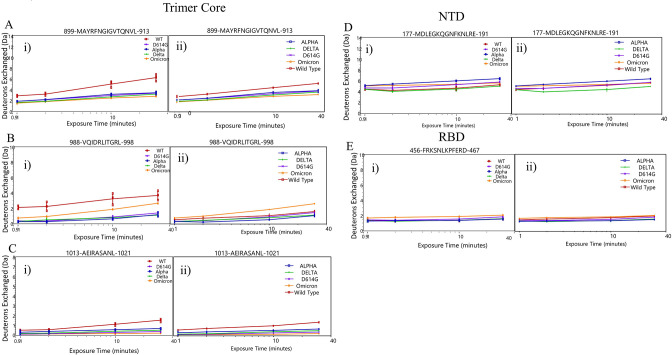
Figure 7—figure supplement 3. Deuterium uptake plots comparing all spike (S) protein variants.

Figure 7—figure supplement 3.

Uptake plots showing incubated wild-type (WT) (red), D614G (purple), Alpha (blue), Delta (green), and Omicron BA.1 (orange) for peptides 899–913 (A), 988–998 (B), 1013–1021 (C), 177–191 (D), 456–467 (E).