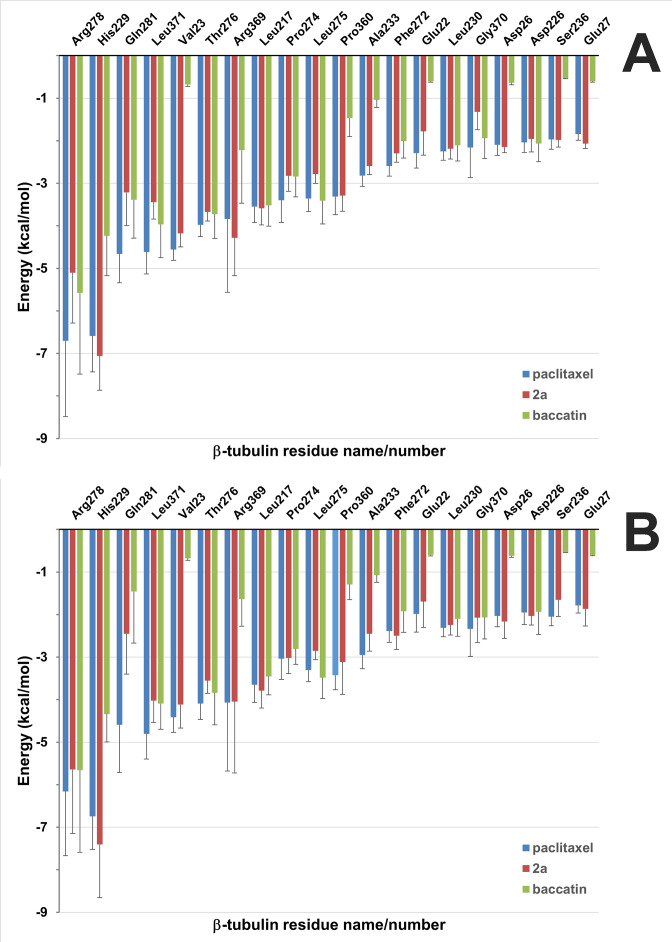
Figure 10. Solvent-corrected interaction energies between individual β2-tubulin residues and ligands throughout the molecular dynamics (MD) simulations of the minimalist representation of a microtubule.
(A) The interfacial site 1 between neighboring protofilamentes. (B) The solvent-exposed site 2. These per-residue energies, which together represent a ‘binding fingerprint’, were calculated by means of the program MM-ISMSA (Klett et al., 2012) using 120 complex structures from the MD simulations after equilibration (5–600 ns), cooling down to 273 K and energy minimization. A cutoff of 1.5 kcal mol–1 was used in the plot for enhanced clarity. Bars are standard errors.

