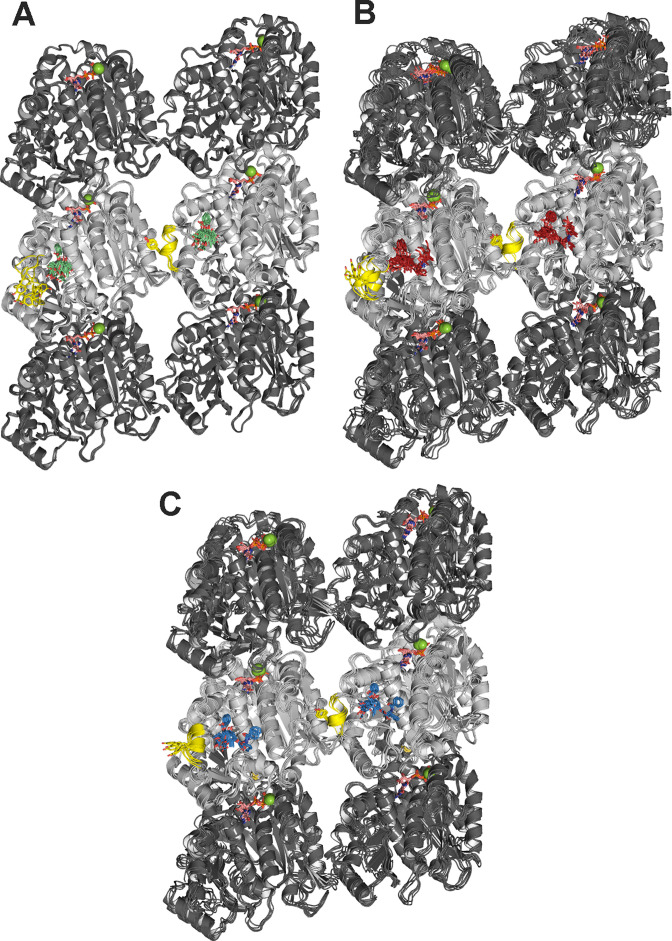
Figure 11. Molecular dynamics (MD simulations of minimalist) representations of a microtubule ((α1-β1-α2)/(α1’-β1’-α2’)) in complex with the ligands employed.
Baccatin III (green, A), 2a (red, B), paclitaxel (blue, C). α- (dark gray) and β-tubulin (light gray) are displayed as ribbons, with the βM loop colored in yellow and the side chain of Tyr283 as sticks. Guanosine diphosphate (GDP) and guanosine triphosphate (GTP) are shown as sticks, with C atoms colored in salmon. Mg2+ ions are displayed as green spheres. Each set of five overlaid structures represents a conformational ensemble made up of snapshots spaced by 5 ns taken from the equilibrated part of the trajectory and then cooled down to 273 K and energy minimized. Site 1 (at the top of each figure) is located at the interface between two neighboring protofilaments whereas site 2 (at the bottom of each figure) is devoid of any lateral contacts but exposed to the bulk solvent instead.

