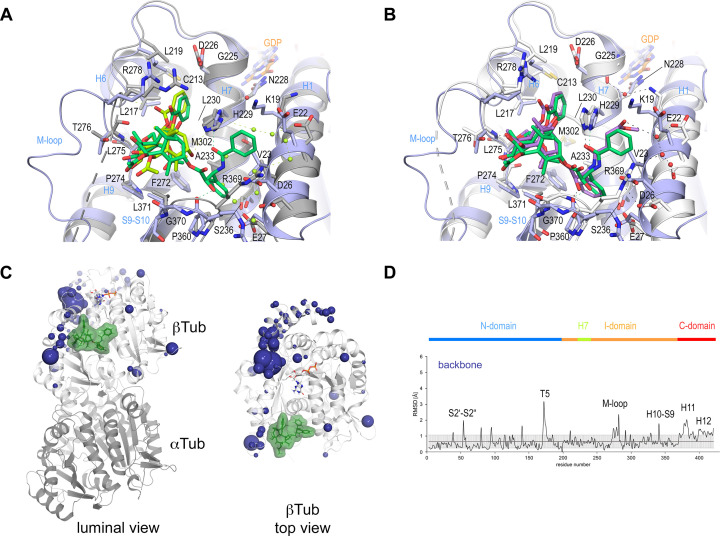
Figure 4. Comparison of taxane binding to unassembled curved versus assembled straight tubulin.
(A) Close-up view of the superimposed baccatin III bound (ligand in lemon; protein in gray ribbon and sticks) to curved tubulin (PDB ID 8BDE) and paclitaxel bound to straight tubulin as found in a microtubule (PDB ID 6WVR; ligand in dark green; protein in slate ribbon and sticks) structures. Interacting residues of tubulin are shown in stick representation and are labeled. Oxygen and nitrogen atoms are colored red and blue, respectively. Hydrogen bonds are depicted as black dashed lines. Secondary structural elements of tubulin are labeled in blue. Water molecules belonging to the baccatin III structure are represented as lemon spheres. The structures were superimposed onto their taxane sites (residues 208–219+225–237+272–276+286–296+318–320+359–376); root-mean-square deviations (rmsd) 0.894 Å (52 Cα atoms). (B) Close-up view of superimposed 2a bound to curved tubulin (PDB ID 8BDF) (ligand in violet; protein in gray ribbon and sticks) and paclitaxel bound to straight tubulin (PDB ID 6WVR; ligand in dark green; protein in slate ribbon and sticks) structures (rmsd 0.826 Å over 52 Cα atoms) using the same settings as in (A). (C) Conformational changes on β-tubulin induced by paclitaxel upon binding to straight tubulin in microtubules (PDB ID 6WVR). The α-tubulin and β-tubulin chains are in ribbon representation and are colored in dark and light gray, respectively. The rmsd differences between unbound and paclitaxel-bound straight tubulin are represented as dark (backbone rmsd) blue spheres. Only the rmsd differences above a threshold of average ± standard deviation are displayed. The sphere radii correspond to the average-subtracted rmsd values displayed in panel (D). (D) Rmsd plots of backbone positions between the paclitaxel bound (PDB ID 6WVR) and the apo (PDB ID 6DPV) straight tubulin in microtubules. The gray error bar represents the average rmsd ± standard deviation. The top bar is colored according to the following domain assignment: N-terminal domain (N-domain., marine blue), intermediate domain (I-domain, orange), central helix βH7 (lemon), and C-terminal domain (C-domain, red). The β-tubulin chains of the corresponding structures were superimposed onto their β-tubulin N-terminal β-sheets (rmsd 0.304 Å over 30 Cα).

