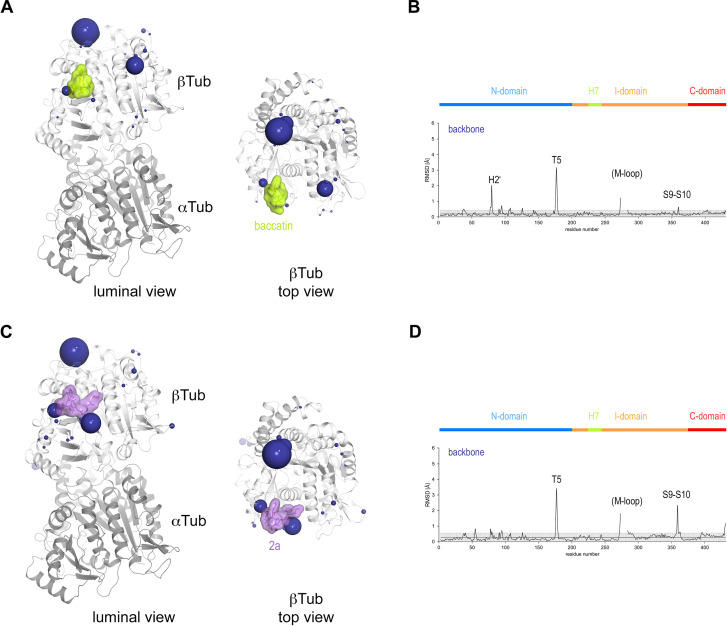
Figure 5. Conformational changes induced by taxane binding to unassembled, curved tubulin.
(A) Conformational changes on the backbone atoms (dark blue) of the β-tubulin chain induced by baccatin III upon binding to curved tubulin. The tubulin chains are in ribbon representation and are colored in dark (α-tubulin) and light (β-tubulin) gray, respectively. The root-mean-square deviation (rmsd) values of the superimposed unbound and baccatin III-bound curved tubulin are represented as dark blue (backbone rmsd) spheres, respectively. Only the rmsd values above a threshold of average + standard deviation are displayed. The sphere radii correspond to the average-subtracted rmsd values displayed in panel (B). (B) Rmsd plots of the backbone (bottom) positions between the baccatin bound (PDB ID 8BDE) and the apo (PDB ID 4I55) curved tubulin state. The gray error bar represents the average rmsd ± standard deviation. The top bar is colored according to the following domain assignment: N-terminal domain (N-domain, marine blue), intermediate domain (I-domain, orange), central helix H7 (lemon), C-terminal domain (C-domain, red). The β-tubulin chains of the corresponding structures were superimposed onto their β-tubulin N-terminal β-sheet (rmsd 0.08 Å over 29 Cα). (C) Conformational changes on the backbone atoms (dark blue) of the β-tubulin chain induced by 2a upon binding to curved tubulin. (D) Rmsd plots of the backbone (bottom) positions between the 2a bound (PDB ID 8BDF) and the apo (PDB ID 4I55) curved tubulin state (rmsd 0.10 Å over 29 Cα). The same display settings as in (B) are applied.

