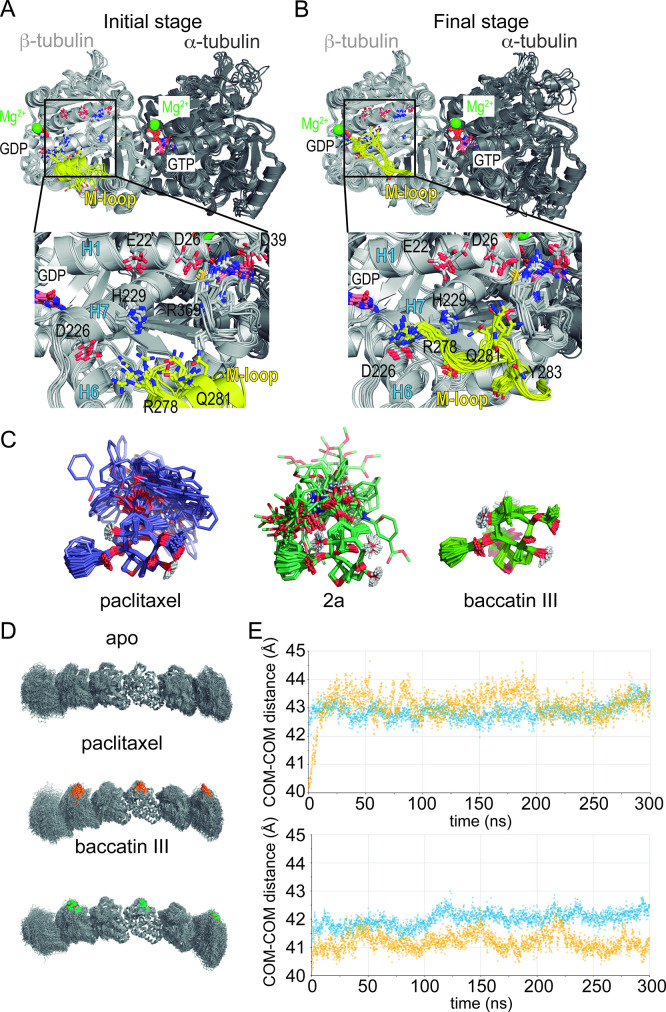
Figure 9. Molecular dynamics (MD) simulation of tubulin-taxane complexes.
(A,B) MD simulations of the free αβ-tubulin dimer. (A) Initial stage of the simulation, starting from a βM loop (residues β275-β286; yellow) organized as an α-helix akin to what is observed in a microtubule and (B) after 100 ns of an MD simulation. (C) Overlaid snapshots taken every 5 ns over the course of a 250 ns MD simulation of paclitaxel (left), 2a (middle), or baccatin III (right). (D) Snapshots of the protofilament model bound to paclitaxel or baccatin III and apo form. (E) Time evolution of the intermonomer distances (measured between the respective centers of mass; α2-β2 in blue and β2-α3 in yellow) in the simulated apo (lower graph) and liganded (upper graph) protofilaments.

