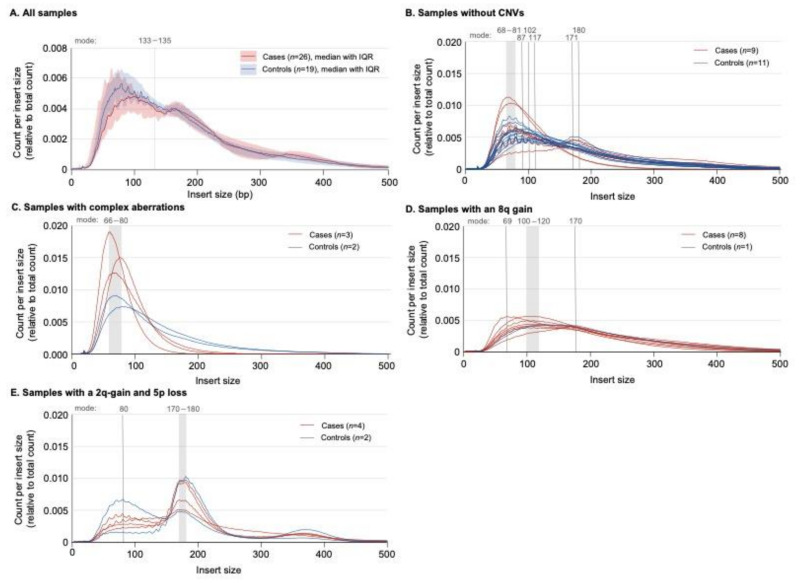
Figure 2.
The fragment lengths’ (insert size) distributions in pancreatic juice (PJ) samples. (A) The cases (red) in comparison with the controls (blue); fragments with a length of 133–135 base pairs (bp) were more prevalent in the controls than cases (p = 0.05; Mann–Whitney U). IQR = interquartile range. (B) Samples without a copy number variation (CNV) on the Wisecondor image. The peak prevalence varied between 65 and 117, 171 and 180 bp. Ten out of twenty samples had a sawtooth pattern (50%), which all showed a showed a second peak at 170–180 bp. (C) Samples with complex (chaotic) aberrations on the Wisecondor image. Each sample harbored mostly short fragments (mode 65–80 bp). The presence of short fragments and the complex (chaotic) aberrations may be related. (D) The samples from individuals with an 8q gain showed a similar graph with a moderate (or no) sawtooth pattern. Six out of eight individuals had a mode between 100 and 120 bp. (E) Samples with a 2p gain and 5q loss: each line shows two peaks (at ±80 bp and 170–180 bp); the first peak has a clear sawtooth pattern.

