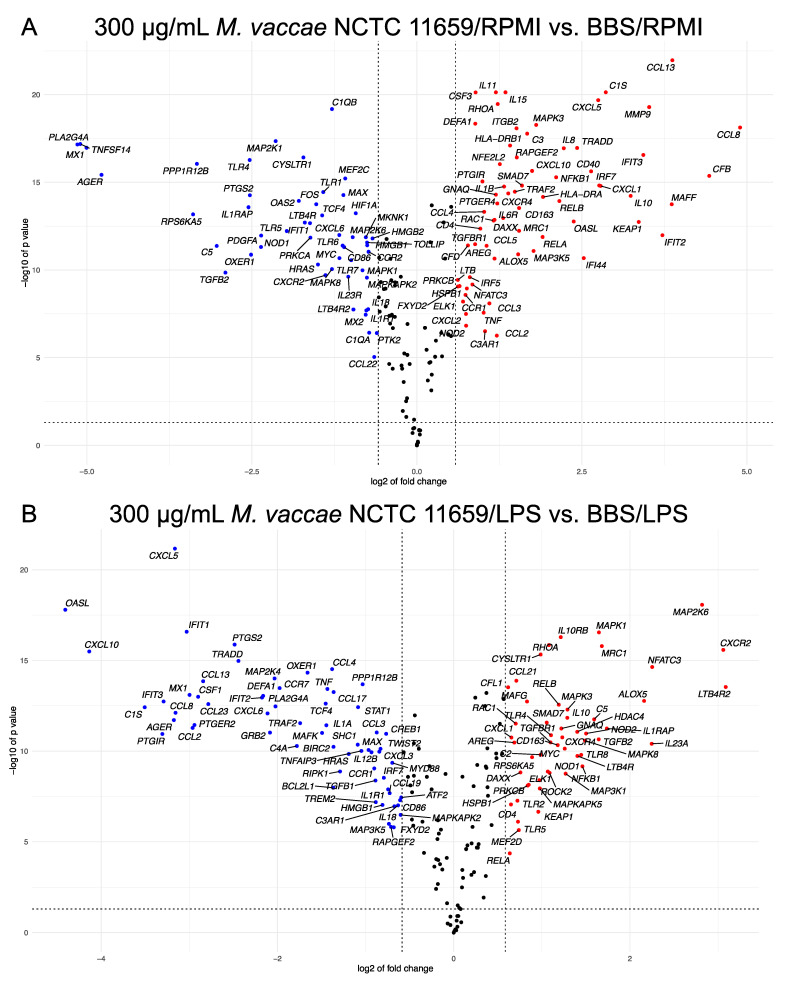
Figure 1.
Volcano plots illustrating that (A) among THP-1-derived macrophages subsequently exposed to RPMI 1640 vehicle for 24 h, M. vaccae NCTC 11659 induced both proinflammatory and anti-inflammatory markers in human THP-1-derived macrophages and (B) among THP-1-derived macrophages subsequently challenged with 250 ng/mL lipopolysaccharide (LPS) for 24 h, M. vaccae NCTC 11659 shifted THP-1-derived macrophages toward an anti-inflammatory bias, for example, with increased IL10, IL10RB, TGFB2, TGFBR1, MRC1 and decreased IL12B expression. The x-axis is the log base 2 of the fold change and the y-axis is the negative log base 10 of the p-value. Each dot in the figure represents a specific gene. The blue dots in the upper left quadrant of the volcano plot represent the genes that were expressed at lower levels in the (A) 300 g/mL M. vaccae NCTC 11659/RPMI 1640 vehicle group or (B) 300 g/mL M. vaccae NCTC 11659/LPS group relative to the BBS vehicle/RPMI 1640 vehicle group or BBS vehicle/LPS group, respectively. The red dots in the upper right quadrant of the volcano plot represent the genes that were expressed at higher levels in the (A) 300 g/mL M. vaccae NCTC 11659/RPMI 1640 vehicle group or (B) 300 g/mL M. vaccae NCTC 11659/LPS group relative to the BBS vehicle/RPMI 1640 vehicle group or BBS vehicle/LPS group, respectively. The black dots represent genes that were not differentially expressed between the groups (i.e., the absolute value of the log base 2 of fold change < 1.5 or p-value > 0.05). The dashed vertical lines represent log base 2-fold changes of approximately –0.6 or 0.6 (i.e., genes with an absolute fold change of at least 1.5). The horizontal dashed line is the negative log base 10 of the adjusted p-value alpha level of 0.05. The volcano plot was generated using the ggplot2 and ggrepel packages. See Supplemental S1. List of abbreviations for all gene symbols for a complete list of definitions of gene symbols (Supplementary Material S1).

