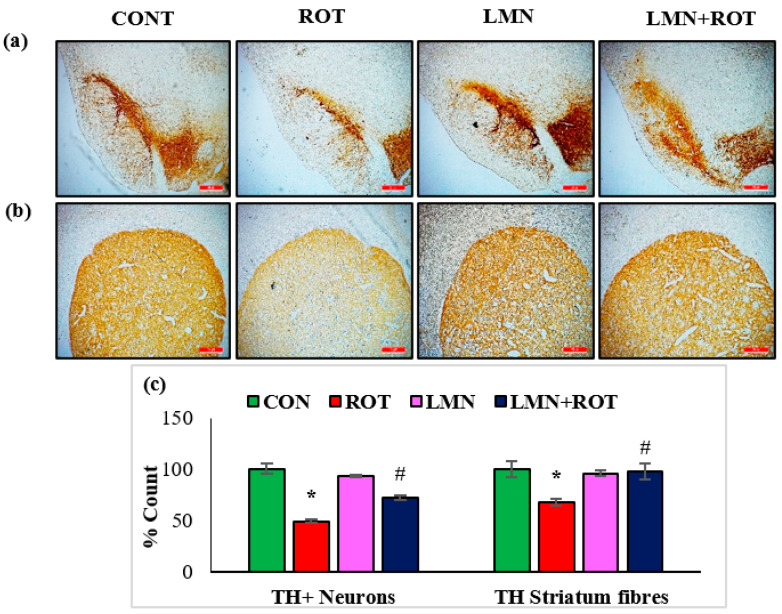
Figure 2.
TH-ir neurons and TH-ir fibers in the substantia nigra (SN) and striatum are presented, respectively (a,b) (scale bar is 20 µm). (c) Quantification of the TH-ir neurons in SNc and the density of TH-ir fibers is also shown. Each group contains three rats, and the data are represented as percent mean ± SEM. * p < 0.05 CON vs. ROT; # p < 0.05 ROT vs. LMN + ROT (one-way ANOVA followed by DMRT). CON: normal control, ROT: rotenone, LMN: limonene, LMN + ROT: limonene and rotenone treatment.

