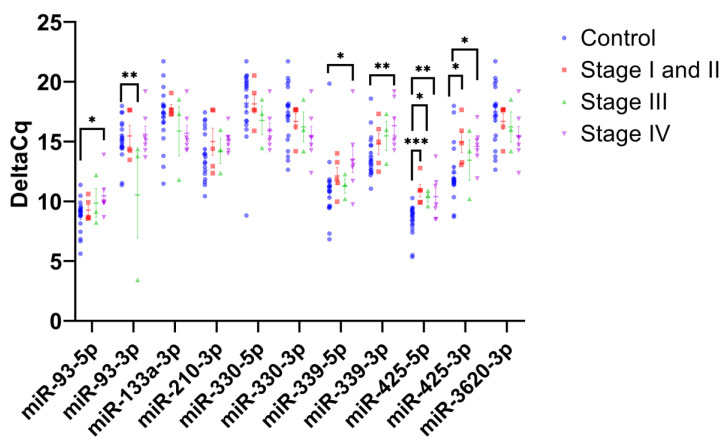
Figure 2.
PDAC stage-specific expression levels of plasma exosomal miRNAs. The scatterplot shows the average ΔCq values for 11 mature miRNAs in PDAC samples separated by staging, early stage (stage I and II, N = 5), mid stage (stage III, N = 3) and late stage (stage IV, N = 7), and compared to control samples (N = 19). Student’s t-test was used to establish significance, where *, **, and *** denote p < 0.05, p < 0.01, and p < 0.001, respectively.

