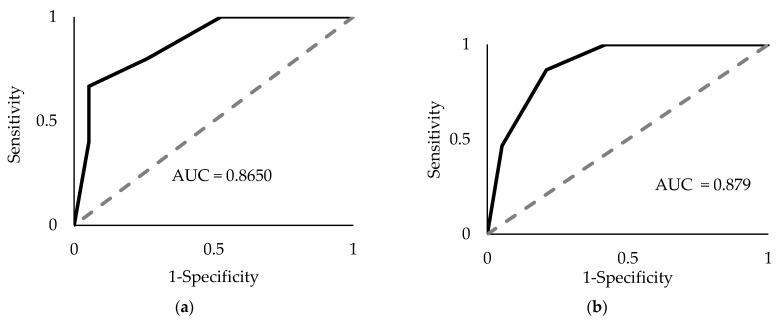
Figure 3.
Receiver operator characteristic (ROC) area under the curve (AUC) analyses. The four-miRNA panel (miR-93-5p, miR-339-3p, miR-425-5p, and miR-425-3p) underwent ROC analysis using the upper limits of the average control ΔCq thresholds (a) and using the lower limit of the average PDAC ΔCq thresholds (b). The values are based off the average ΔCqs for each miRNA in either control or PDAC plasma samples with 99% CI for all such values.

