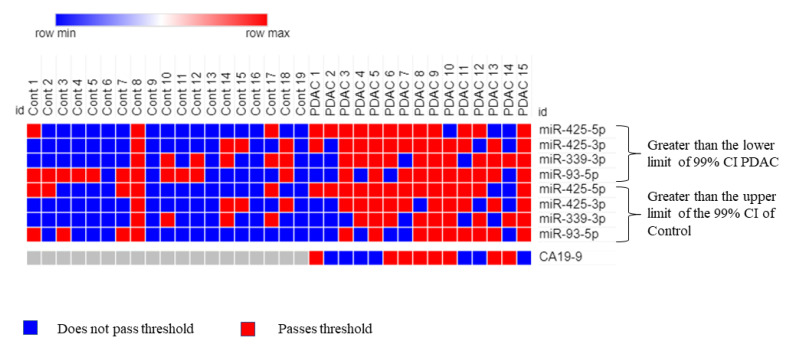
Figure 5.
Analyzing PDAC and control samples using the combined four-miRNA biomarker panel. The heatmap shows which samples surpassed the two thresholds (ΔCq is greater than the upper limit of the control for each miRNA AND ΔCq is greater than the lower limit of PDAC for each miRNA, 99% CI), indicating a positive hit for PDAC. Red indicates a positive hit and blue indicates a negative hit. Columns labeled as “Cont” represent control plasma samples while columns labeled as “PDAC” represent plasma from patients with pancreatic cancer. PDAC 1, 2, 3, 4, and 5 represent early-stage (I and II) pancreatic cancer; PDAC 6, 7, and 12 represent mid-stage (stage III) pancreatic cancer; and PDAC 8, 9, 10, 11, 13, 14, and 15 represent late-stage (stage IV) pancreatic cancer. CA19-9 values are added for comparison where the threshold is the medically established value of >37 U/mL.

