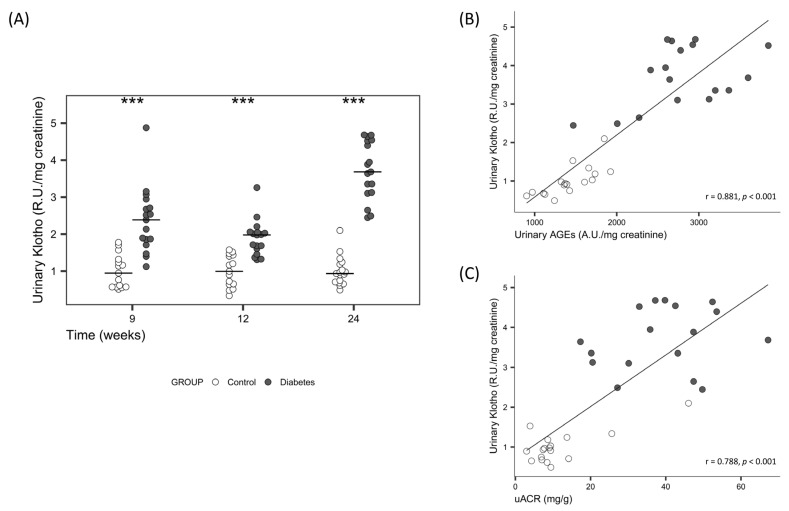
Figure 1.
(A) Time course of urine sKlotho protein levels on Week 9, 12 and 24 in controls and diabetic rats. Non-parametric Wilcoxon rank sum test was used. Horizontal line represents median. *** p < 0.001 vs. control. Correlation between urinary sKlotho and (B) urinary AGEs and (C) uACR, in Week 24. Linear regression was used. R.U.: relative units; uACR: urinary albumin/creatinine Ratio; AGEs: advanced glycation end products.

