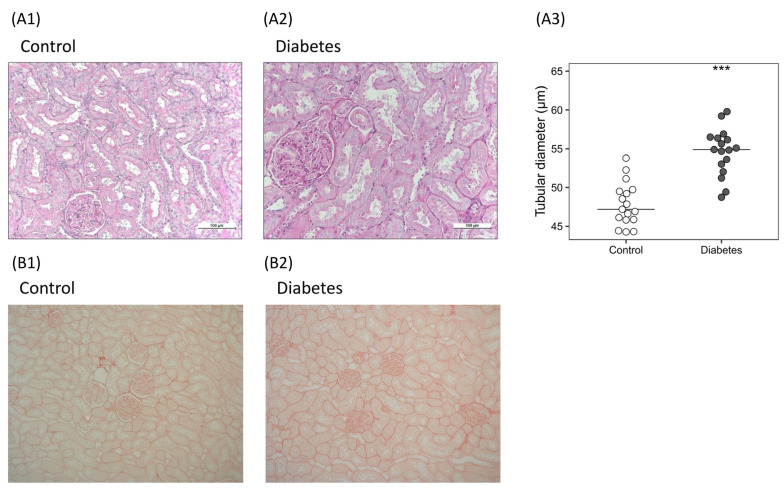
Figure 3.
Histological findings in the kidneys of the diabetic rats. (A) Renal hypertrophy: representative images of histological sections stained with periodic acid–Schiff in (A1) control and (A2) diabetic rats, and quantification of (A3) proximal tubules diameter. Non-parametric Wilcoxon rank sum test was used. Horizontal line represents median. *** p < 0.001 vs. control. (B) Kidney fibrosis: representative images of histological sections stained with Picrosirius Red in (B1) control and (B2) diabetic rats.

