
Extended Data Figure 5. Assessing convergence of representative cryoDRGN density maps during high-resolution training.
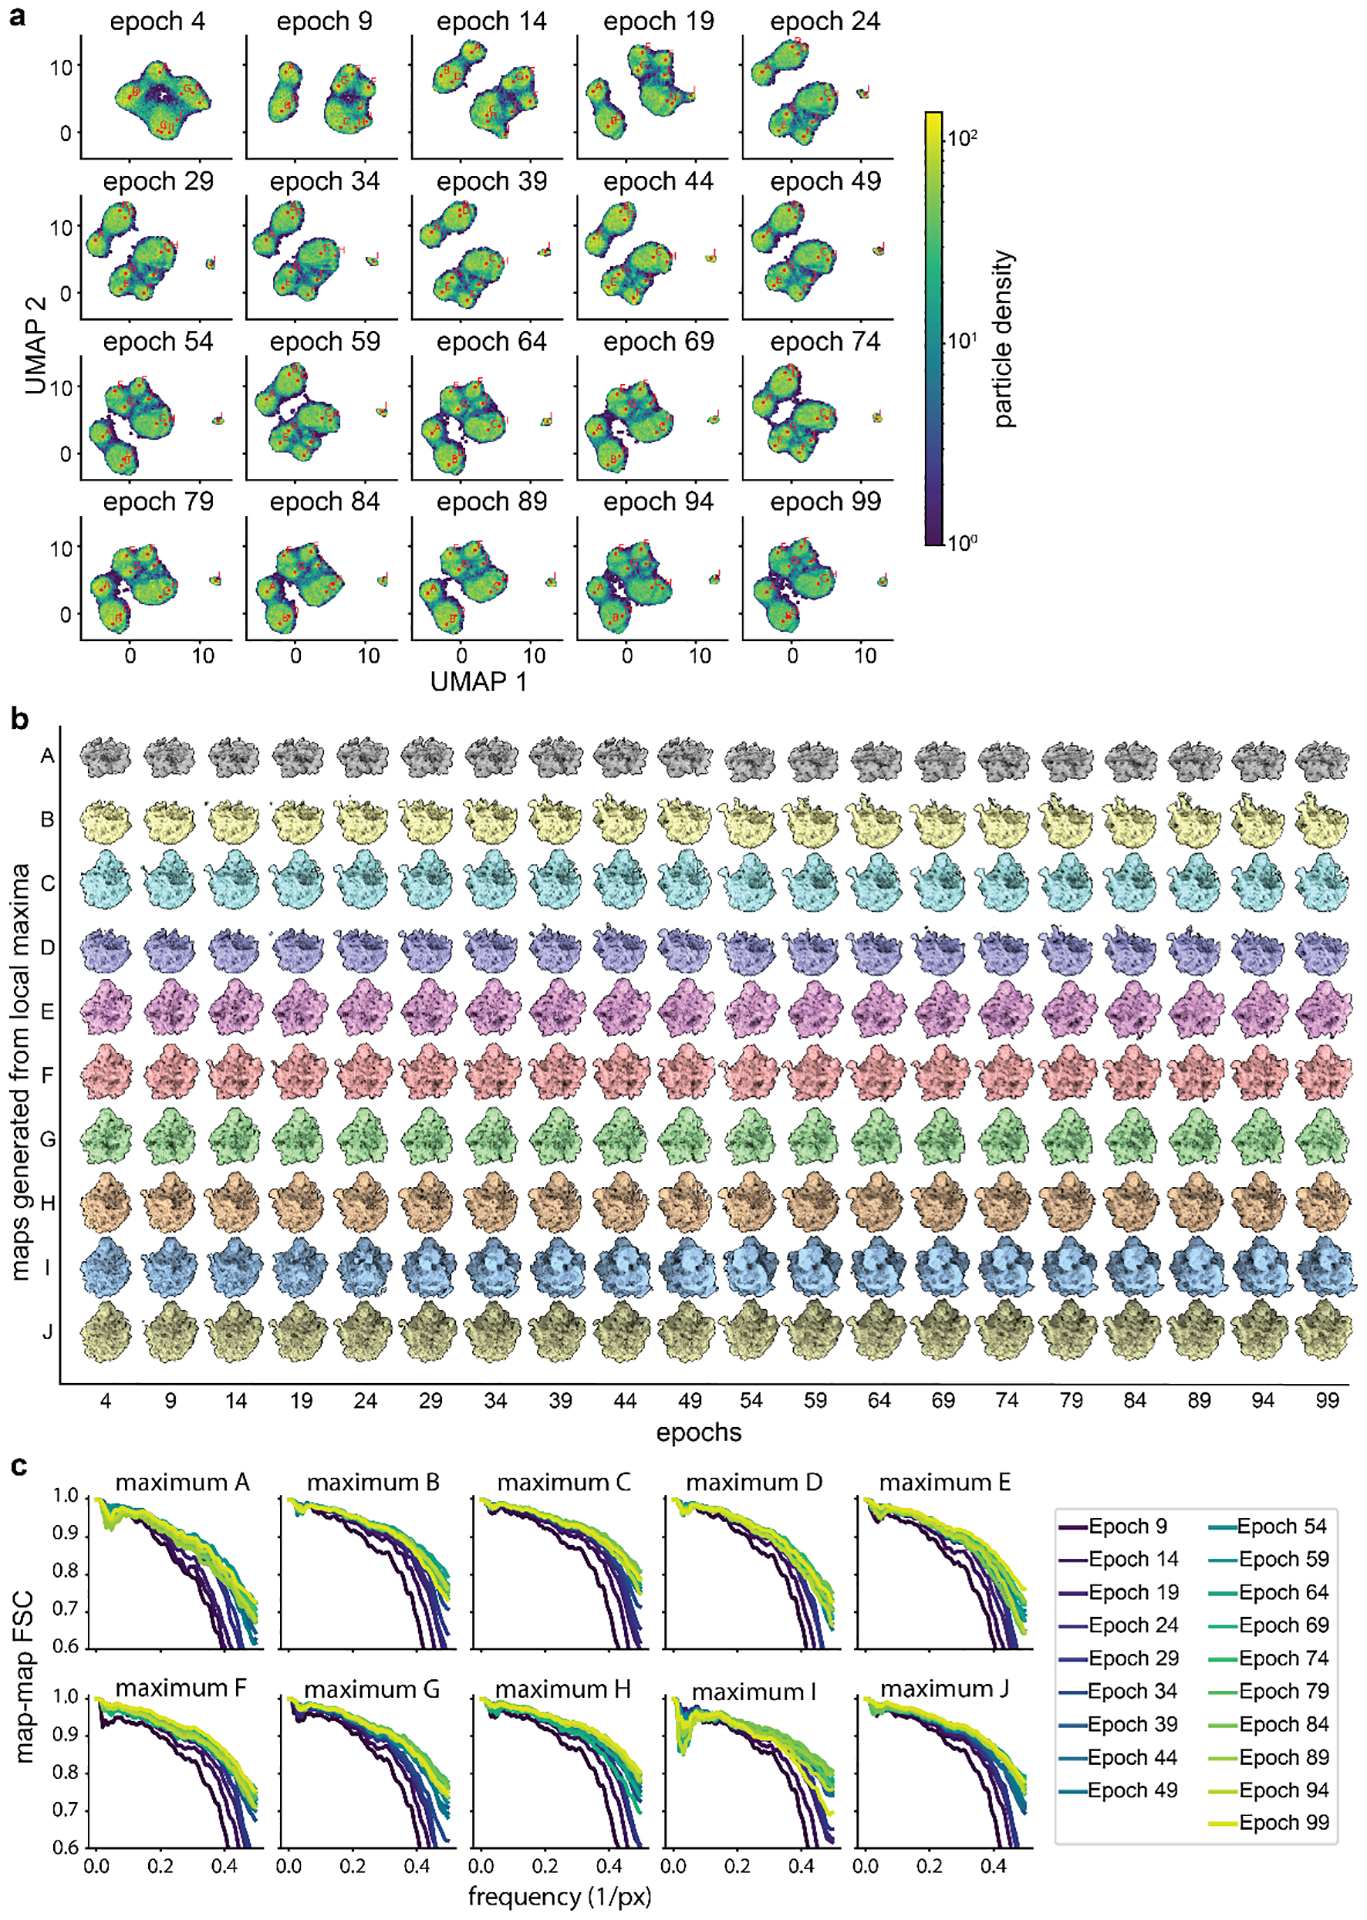
a) Particle sets A-J identified by the “UMAP local maximum” method (Glossary) mapped to prior epochs as illustrated in Extended Data Figure 2. b) Corresponding volumes generated from labeled positions in panel a. Note that the volumes’ gross morphology stabilizes by epoch 19–29, though maximum I stabilizes as a 70S ribosome around epoch 39. c) FSC plots between volumes from each local maximum offset by 5 epochs of training, as in Extended Data Figure 2. The map-to-map FSC stabilizes by epoch 39.