
Extended Data Figure 3. Visualizing particle filtering.
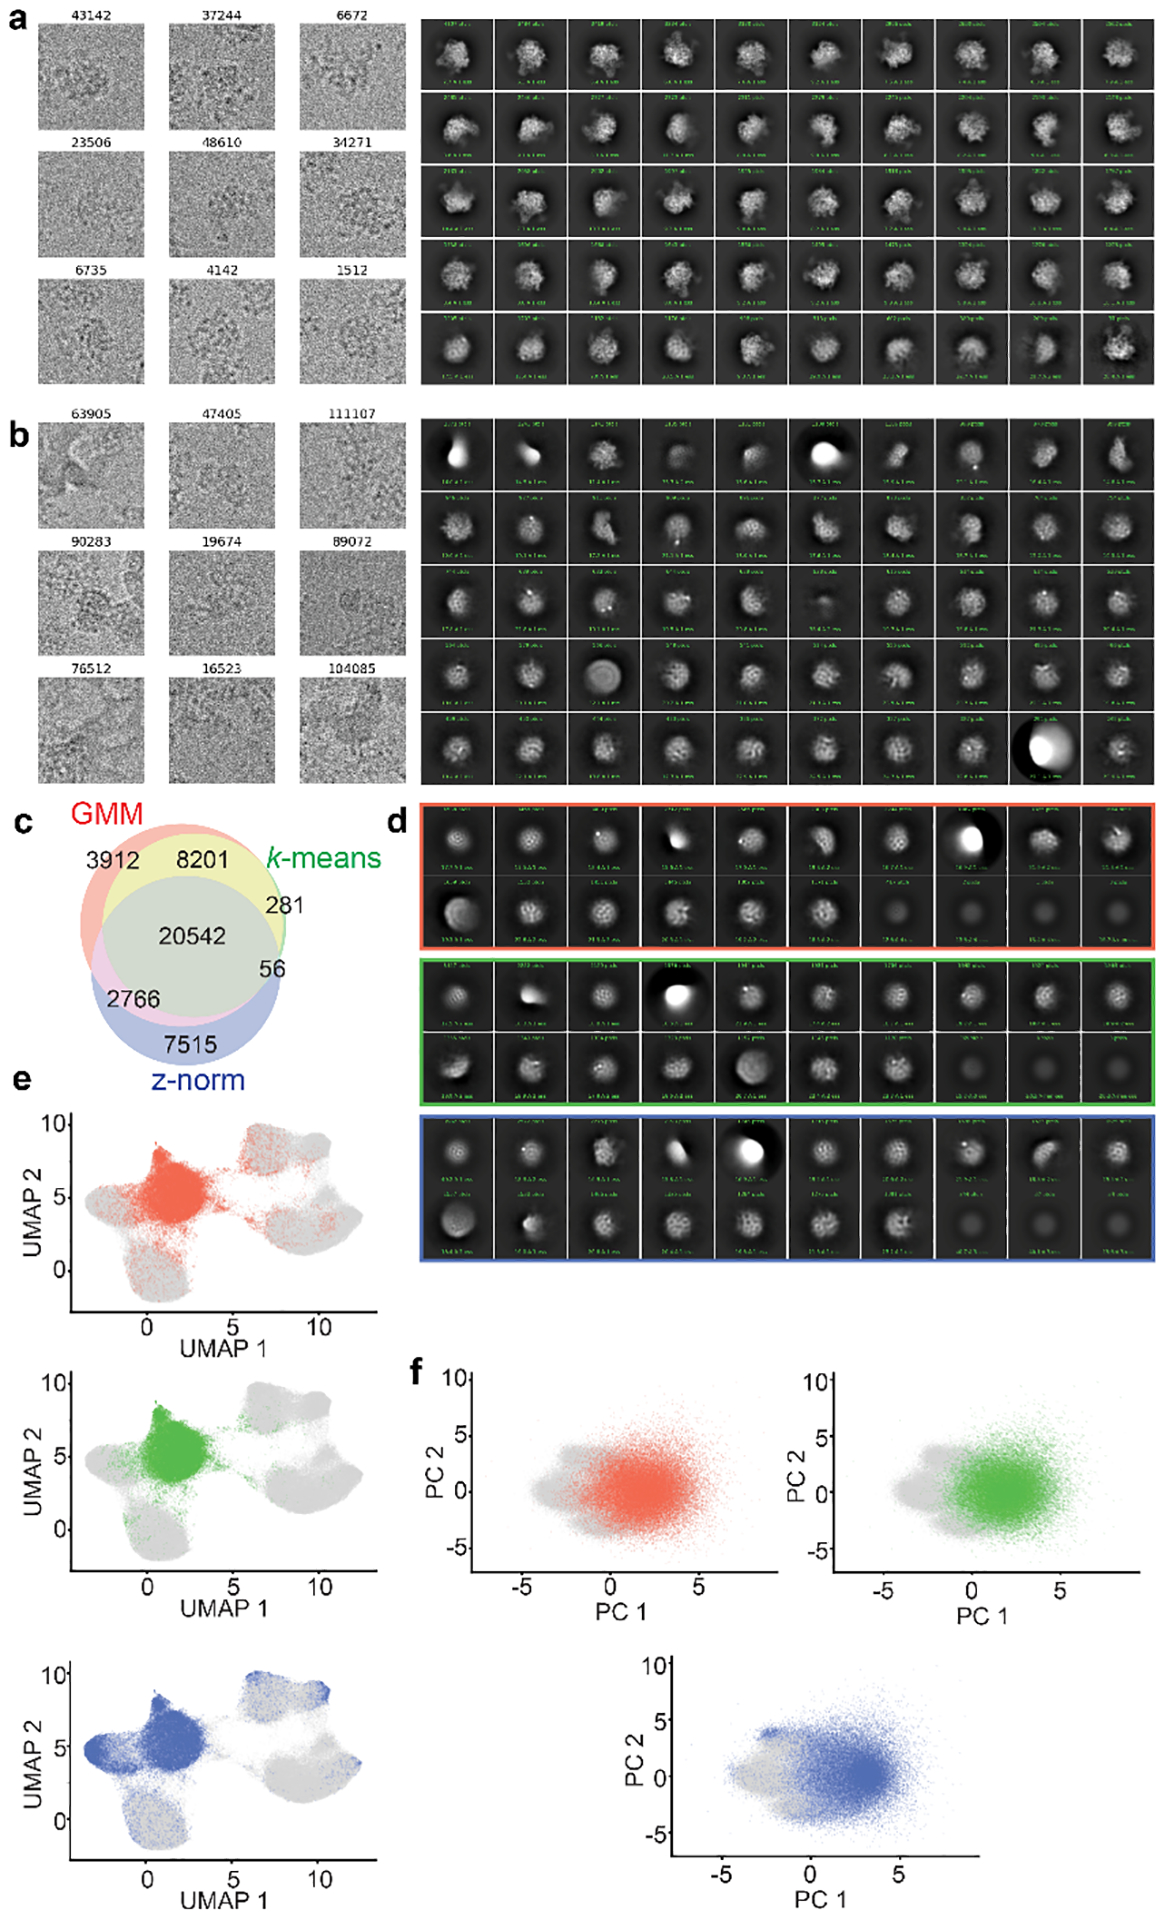
a) Representative particles filtered by ind_keep.star, selected for further training, and corresponding 2D-classification using default cryoSPARC parameters. b) Representative particles filtered by ind_bad.star, excluded from further training, and corresponding 2D-classification using default cryoSPARC parameters. c) Three-way Venn diagram of “junk” particles identified by one of the following methods: two classes from k=6 gaussian mixture model latent-space classification (red, 35,421 particles); ten classes from k=20 k-means latent-space classification (green, 29,080 particles); or latent encoding magnitude (z-norm) exceeding 0.5 standard deviations larger than the mean (blue, 30,879 particles). d) Corresponding CryoSPARC 2D-classification results using “junk” particles identified through the GMM (top), k-means (middle), or z-norm (bottom) filtering approaches. e) UMAP embedding or f) PCA projections highlighting location of junk particles identified by GMM (red), k-means (green), or z-norm (blue) methods.