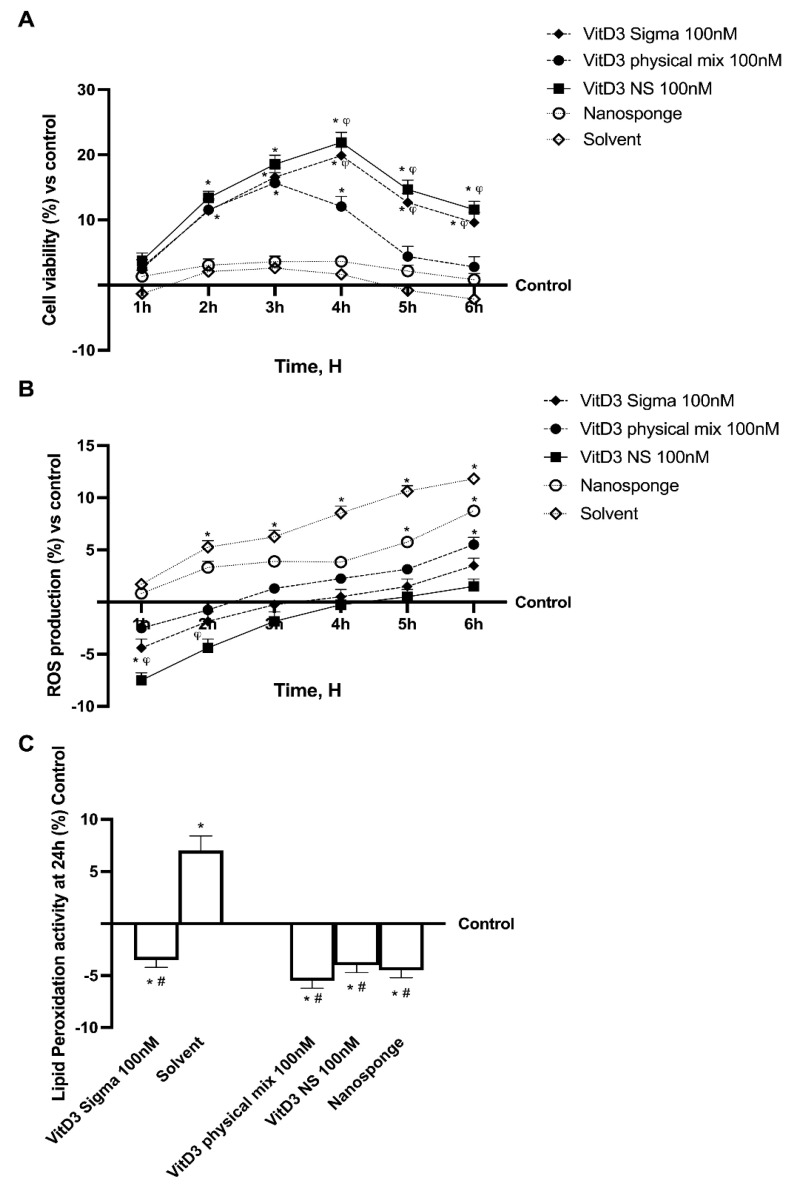
Figure 2.
Analysis of different forms of VitD3 in time-dependent study. (A) Mitochondrial Metabolism, (B) ROS production and (C) Lipid Peroxidation analysis. Data are expressed as mean ± SD (%) of 5 independent experiments normalized to control. (A,B) * p < 0.05 vs. control; φ p < 0.05 vs. VitD3 physical mix 100 nM (C) * p < 0.05 vs. control (untreated cells); # p < 0.05 vs. Solvent (ethanol).

