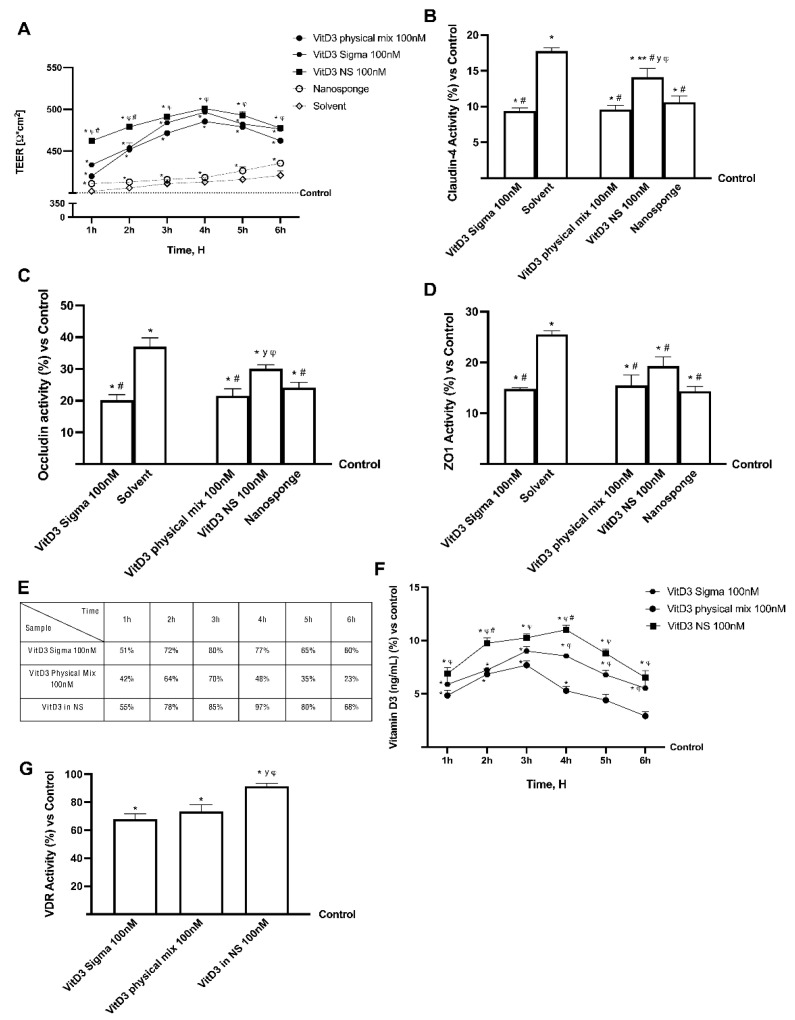
Figure 3.
Permeability study on CaCo-2 cells. In (A) TEER (transepithelial electrical resistance) Value using EVOM3; from (B–D) the analysis of TJ measured by Enzyme-Linked Immunosorbent Assay (ELISA) test (Occludin, Claudin1, and ZO-1 (Zona occludens 1), respectively); in (E) the Papp (Apparent Permeability Coefficient) values in which data < 0.2 × 10⁻⁶ cm/s mean very poor absorption with a bioavailability < 1%, data between 0.2 × 10⁻⁶ and 2 × 10⁻⁶ cm/s with bioavailability between 1 and 90%, and data > 2 × 10⁻⁶ cm/s mean very good absorption with a bioavailability over 90%. In (F) VitD3 quantification measured by ELISA kit. In (G) Vitamin D3 Receptor activity measured by ELISA kit. Data are mean ± SD of five independent experiments performed in triplicates. From (B–D) means ± SD are expressed comparing data to control value (0% line) and all molecules result * p < 0.05 vs. control; ** p < 0.05 vs. nanosponge; # vs. solvent; y vs. VitD3 Physical Mix 100 nM; φ vs. VitD3 Sigma 100 nM. On the contrary, in (A,E,F), the control samples are specifically reported and VitD3 NS 100 nM, VitD3 Physical Mix 100 nM and VitD3 Sigma 100 nM are p < 0.05 vs. control. In conclusion, in (G) means ± SD are expressed comparing data to control value (0% line) and all molecules result * p < 0.05 vs. control; φ p < 0.05 vs. VitD3 physical mix 100 nM; # p < 0.05 vs. VitD3 sigma.

