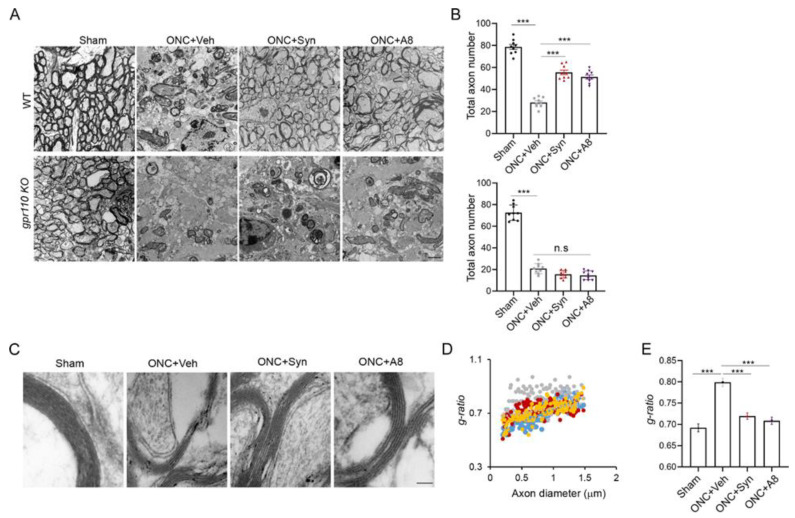
Figure 5.
Structural integrity of axons deteriorated by ONC was improved by treatment with GPR110 ligands. (A,B) Transmission electron microscopic images show cross sections of the optic nerves from sham and vehicle-, synaptamide- or A8-treated WT or gpr110 KO mice at 12 weeks after ONC (A), and the quantitation of the total axon number per field (B). Data are expressed as mean ± s.e.m. of the total 9 sections (3 sections per mouse) from 3 mice per group. (C–E) Electron microscopic images show the thickness of the myelin sheath of the axon fibers at 12 weeks after ONC (C) and the scatter plot for the g-ratio (the ratio of the inner to the outer diameter of the myelin sheath) as a function of axon diameter (D), along with the average g-ratio for the sham (blue), ONC + vehicle (grey), ONC + synaptamide (red) and ONC + A8 (orange) groups (E). Data are expressed as mean ± s.e.m. of the total 114 axons from 6 mice per group. *** p < 0.001. Scale bars, 2 μm (A) and 100 nm (C). n.s., not significant.

