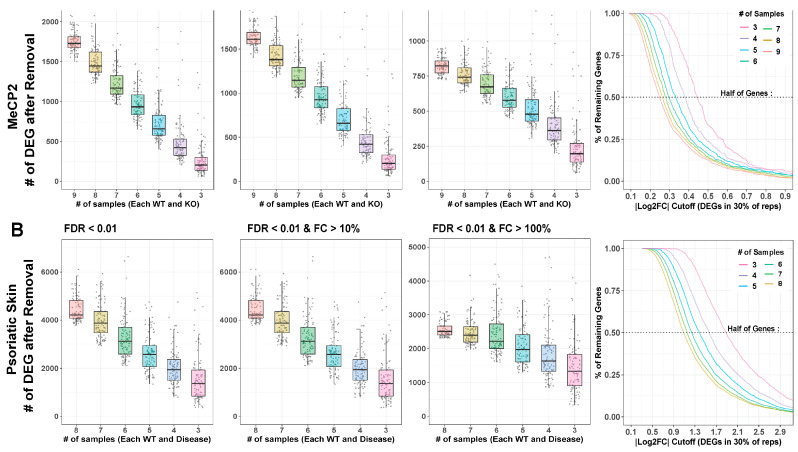
Figure 5.
Downsampling analysis. (A,B). Large contrasts from MeCP2 and lesional psoriatic skin data were downsampled to smaller and more common experimental sample number, and DEG analysis was run on these subsets. Box plot and jitter points are plotted for resultant DEG numbers under each condition. Cutoffs for MeCP2 are sample numbers 9 through 3. Cutoffs for psoriatic data are sample numbers 8 through 3. Each cutoff number was repeated 100 times, with random samples discarded each time. Results are plotted at FDR < 0.01. MeCP2 data are fold change (FC) cutoff at any FC, FC > 10%, and FC > 20%. Psoriatic skin data are FC cutoff at any FC, FC > 10%, and FC > 200%. Curves indicate the percent of DEGs remaining at continuous |log2 fold change| cutoffs. Horizontal line indicates 50% of genes removed.

