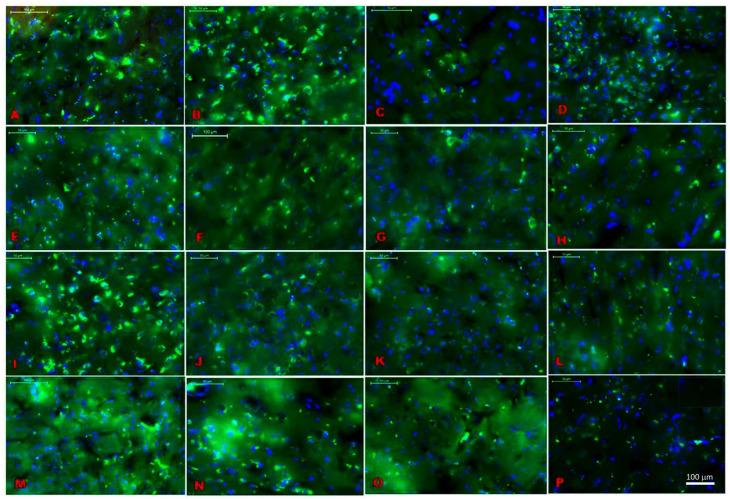
Figure 1.
MT1 receptor distribution using FITC (florescent green) and DAPI (blue) staining in the specific brain regions. (A) Ventral posteromedial thalamic nucleus (VPM), (B) Somatosensory cortex (S1), (C) Dentate gyrus (DG), (D) Amygdalostriatal transition area (Astr), (E) Secondary auditory cortex (AUD), (F) Basolateral amygdala (Bla), (G) Lateral hypothalamus (LH), (H) Magnocellular region (Mc), (I) Magnocellular nucleus of lateral hypothalamus (Mclh), (J) Nigrostriatal fibers (Ns), (K) Posterior hypothalamic area (Ph), (L) Retrosplenial agranular cortex (Rsa), (M) Posterior thalamic nuclear group (Po), (N) Ventromedial thalamic nucleus (VM), (O) Ventromedial hypothalamic nucleus (VMH), and (P) Reticular thalamic nucleus (RT). Scale bar is 100 μm.

