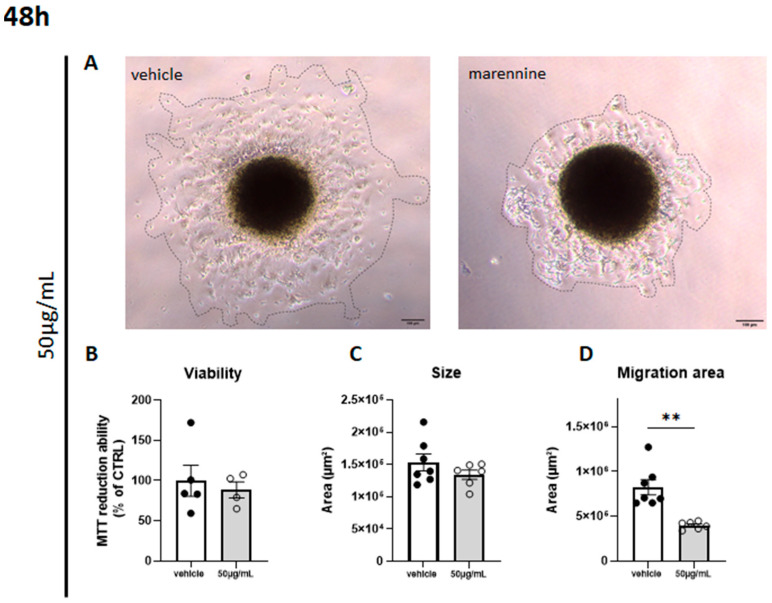
Figure 6.
Effects of 50 µg/mL marennine on cell migration after 48 h exposure. (A) Representative images were taken using a 10× objective of a phase-contrast microscope; the outer dark circles in the phase-contrast images indicate the area covered by the migrated cells. (B) Cell viability was determined using MTT assay; vehicle n = 5, marennine n = 4. (C) Quantification of neurosphere size after migration; vehicle n = 7, marennine n = 6. (D) Quantification of the migration area covered by migrating cells from the core of the neurosphere; vehicle n = 7, marennine n = 6. Scale bar = 100 µm. Values represent mean ± SEM. Significant differences from control are indicated: ** p < 0.01.

