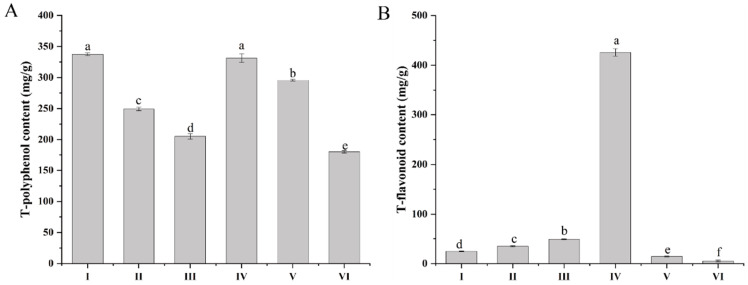
Figure 1.
The contents of flavonoids and polyphenols in different extraction fractions. I, ethanol extract; II, PE fraction; III, chloroform fraction; IV, EtOAc fraction; V, n-BuOH fraction; VI, residual ethanol solution fraction. (A) Total polyphenol content; (B) Total flavonoid content; Different letters (a–f) represent significant differences among groups (p < 0.05). Values are expressed as the mean ± SD.

