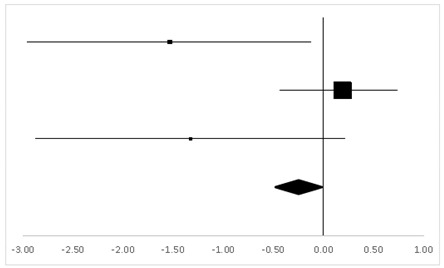
Table 5.
ES and forest plot of DSB.
| Effect Size | Forest Plot | ||||
|---|---|---|---|---|---|
| Studies | Weight | Random, 95% CI | Random, 95% CI | ||
| ES | Low | High | |||
| Philip | 14.92% | −1.54 | −2.95 | −0.13 |

|
| Gregory | 72.28% | 0.19 | −0.36 | 0.73 | |
| Carine | 12.8% | −1.33 | −2.86 | 0.21 | |
| Total | 100% | −0.26 | −0.83 | 0.30 | Test for overall effect: Z = −0.91 (p > 0.05) |
| Heterogeneity: Q = 7.29, df = 2, C = 7.34, T2 = −0.72 | |||||
