
Table 6.
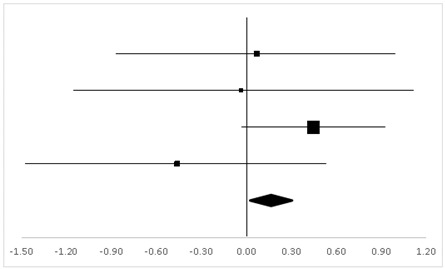
ES and forest plot of FTL.
| Effect Size | Forest Plot | ||||
|---|---|---|---|---|---|
| Studies | Weight | Random, 95% CI | Random, 95% CI | ||
| ES | Low | High | |||
| Gregor | 18.9% | 0.07 | −0.86 | 0.99 |
|
| Hornbein (Operation) | 13.24% | −0.04 | −1.17 | 1.09 | |
| Hornbein (Mountaineers) | 51.18% | 0.45 | −0.03 | 0.92 | |
| Carole | 16.69% | −0.46 | −1.46 | 0.53 | |
| Total | 100% | 0.16 | −0.27 | 0.59 | Test for overall effect: Z = 0.72 (p > 0.05) |
| Heterogeneity: Q = 3.07, df = 3, C = 18.39, T2 = 0.004 | |||||