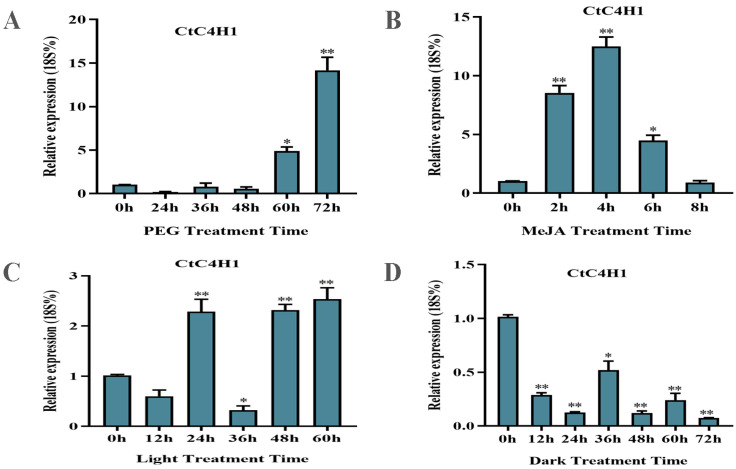
Figure 6.
Expression analysis of CtC4H1 gene under different abiotic stress conditions. (A) PEG treatment. (B) MeJA treatment. (C) Light treatment and (D) dark treatment. The relative expression level was normalized with 18S rRNA gene which was used as housekeeping gene. The numerical value represents the average ± standard deviation of three biological repetitive samples. The statistics were calculated with one-way ANOVA test and significant differences between treatments were demonstrated with asterisk (* p < 0.05, ** p < 0.01).

