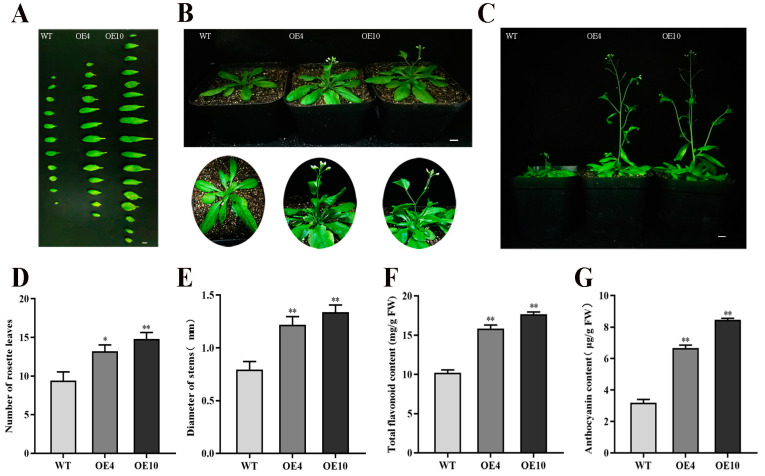
Figure 7.
Phenotypic analysis and quantification of total flavonoids and anthocyanin content in two transgenic OE lines of Arabidopsis (OE-4 and OE-10) and WT. (A) Leaf morphology of CtC4H1 transgenic OE and WT plants (B) phenotypic analysis of CtC4H1 transgenic OE and WT seedlings in the soil (C) stem growth of CtC4H1 transgenic OE and WT plants. Bars = 1 cm (D) Number of rosette leaves. (E) Diameter of stems. (F) Total flavonoids content of WT, CtC4H1 transgenic lines. (G) Anthocyanin content of WT, CtC4H1 transgenic lines. The numerical value represents the average ± standard deviation of three biological repetitive samples. The statistics were calculated with one-way ANOVA test and significant differences between treatments were demonstrated with asterisk (* p < 0.05, ** p < 0.01).

