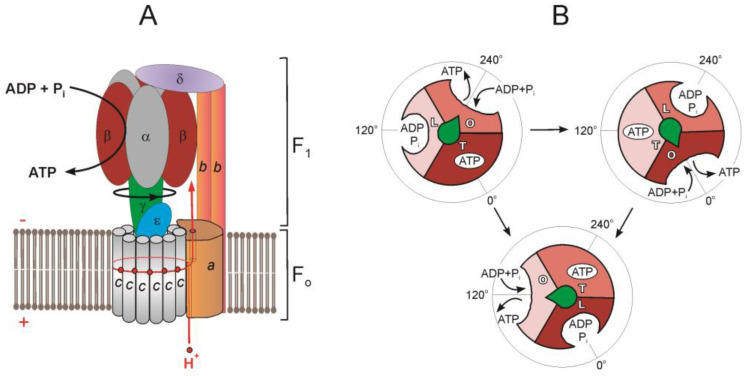
Figure 1.
Schematic illustration showing the arrangement of subunits in F1·Fo-ATP synthase/ATPase (E. coli) (A) and chemomechanical coupling scheme of F1·Fo-ATPase (B). (A) Shown are subunits α (grey), β (brown), γ (green), ε (blue), c (grey), a (light brown), b (orange), and δ (purple). F1 and Fo, ATP synthesis reaction and direction of γ-subunit rotation during ATP synthesis are marked. The proton pathway is depicted in red. The position of the half channels in a subunit is shown with a thin line. (B) Scheme of the F1-ATPase rotary catalytic mechanism. Each αβ subunit pair is shown in brown, light brown, and beige. Binding site occupation marked with letters: O, open; L, loose; and T, tight. The γ-subunit is depicted as a green arrow, and, for clarity, the other subunits are not shown. For a more detailed scheme with the indication of substages proposed for different bacterial and eukaryotic F1·Fo, see review by Noji and Ueno [8].

