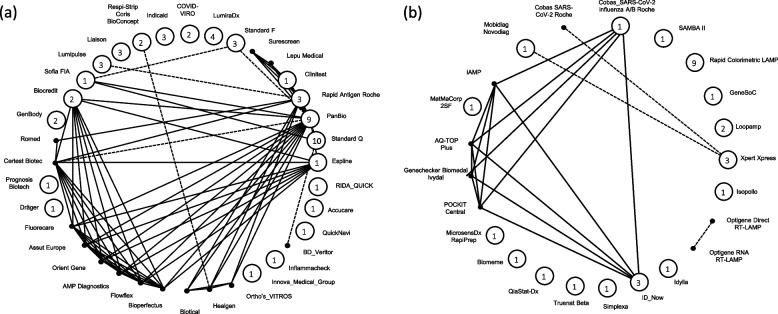
Fig. 2.
Network geometry of the included studies for (a) rapid antigen tests and (b) rapid molecular tests. Each vertex represents a different test, and each edge corresponds to at least one study comparing the two tests. Closed circles represent tests compared in single-test studies, and numbers in the circles show the number of single-test studies informing the underlying test. Solid black dots (non-closed circles without an enclosed number) represent tests compared in paired- or multi-test studies only. Dashed lines and solid lines represent paired-test and multiple-test studies, respectively

