
FIGURE 4.
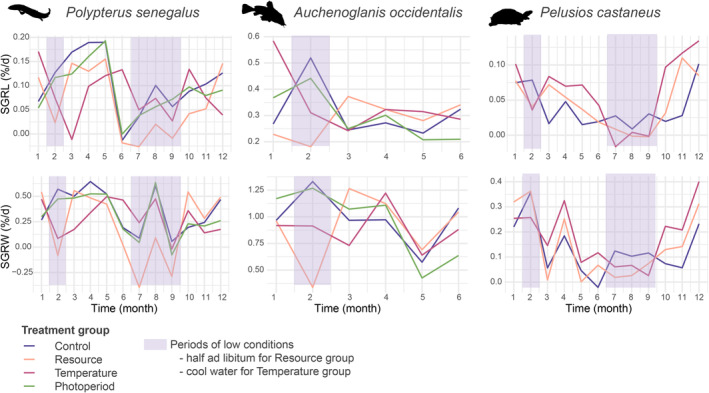
Average growth rates (SGRL and SGRW) in the different treatment groups of the three studied species during the experiment.
Official websites use .gov
A
.gov website belongs to an official
government organization in the United States.
Secure .gov websites use HTTPS
A lock (
) or https:// means you've safely
connected to the .gov website. Share sensitive
information only on official, secure websites.
Average growth rates (SGRL and SGRW) in the different treatment groups of the three studied species during the experiment.