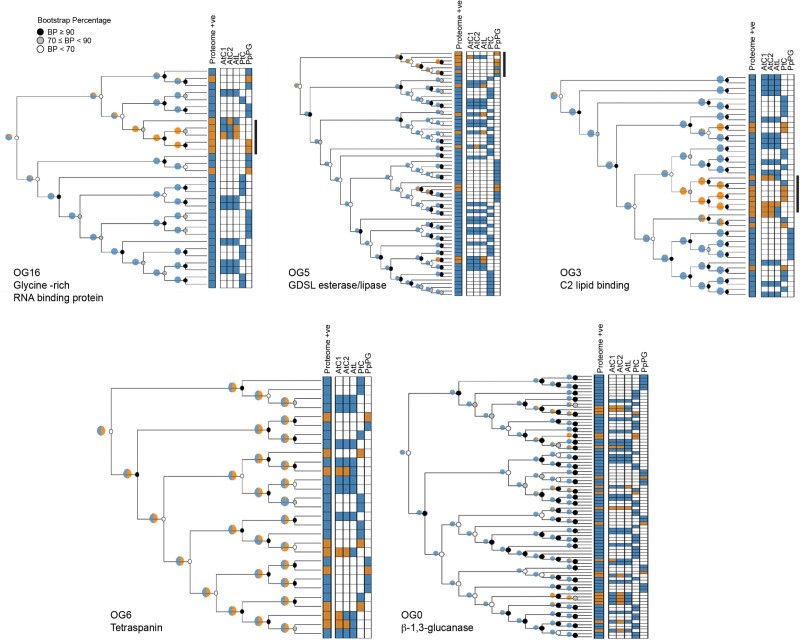
Fig. 5.
Unrooted cladograms of orthogroup members from A. thaliana, P. trichocarpa, and P. patens as defined by a hmmsearch with a threshold of E <1 × 10–100 (OG0/OG3/OG5) or E <1 × 10–0 (OG6/OG16). Each tree has a heatmap of proteome matches for each protein in the tree, with orange indicating a proteome hit and blue indicating that the protein was not detected in the relevant proteome(s). For OG3, OG5, and OG16, plasmodesmal association appears to primarily correlate with a single clade within the tree, indicated by the black bar to the right of the proteome heatmap. Pie charts estimate the likely ancestral plasmodesmal localization (orange) by phylogenetic backpropagation. Node support is indicated by greyscale circles.

