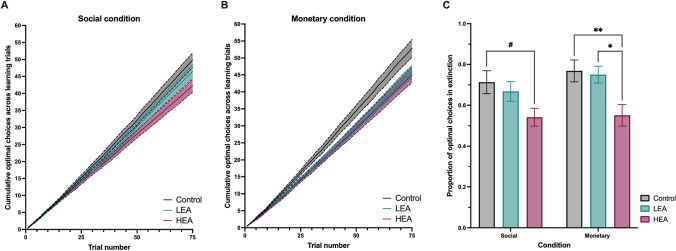
Fig. 2.
Social and monetary reward learning task performance. (A) Plot of cumulative optimal choices across learning trials (i.e., learning rate) in the social condition for Controls, low emotional apathy (LEA), and high emotional apathy (HEA) patients. (B) Plot of cumulative optimal choices across learning trials (i.e., learning rate) in the monetary condition for Controls, LEA, and HEA patients. Steeper slopes indicate faster learning. (C) Overall social and monetary reward learning performance, denoted by proportion of optimal choices made in extinction on the post-learning choice test for the social and monetary conditions across groups. See also Supplementary Figure 1 for individual post-learning choice test performance according to diagnosis group. Error bars represent standard error of the mean. **p < 0.01; *p < 0.05; #trend towards significant effect

