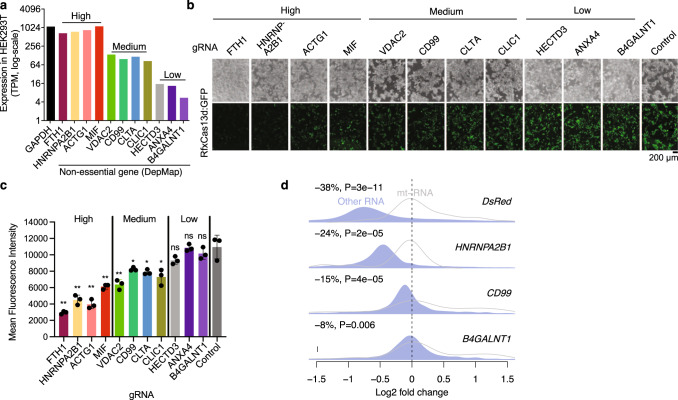
Fig. 2. CRISPR/RfxCas13d collateral activity triggered by endogenous RNA targeting.
a Expression levels of tested endogenous genes in HEK293T cells. b Representative image of GFP when each gene was targeted individually. c Quantification of GFP in (b, N = 3). d Density plots of log2 fold changes (knockdown vs. control) of all transcripts normalized to mitochondrial RNAs (RNA-seq). Median down-regulation (%) and the P value are shown at the top left corner of each panel. Two replicates were pooled for (d). Two-way ANOVA was used for (c). Wilcoxon Rank Sum Test was used for (d). *p < 0.05; **p < 0.01. TPM tags per million. Error bars represent standard deviation.

