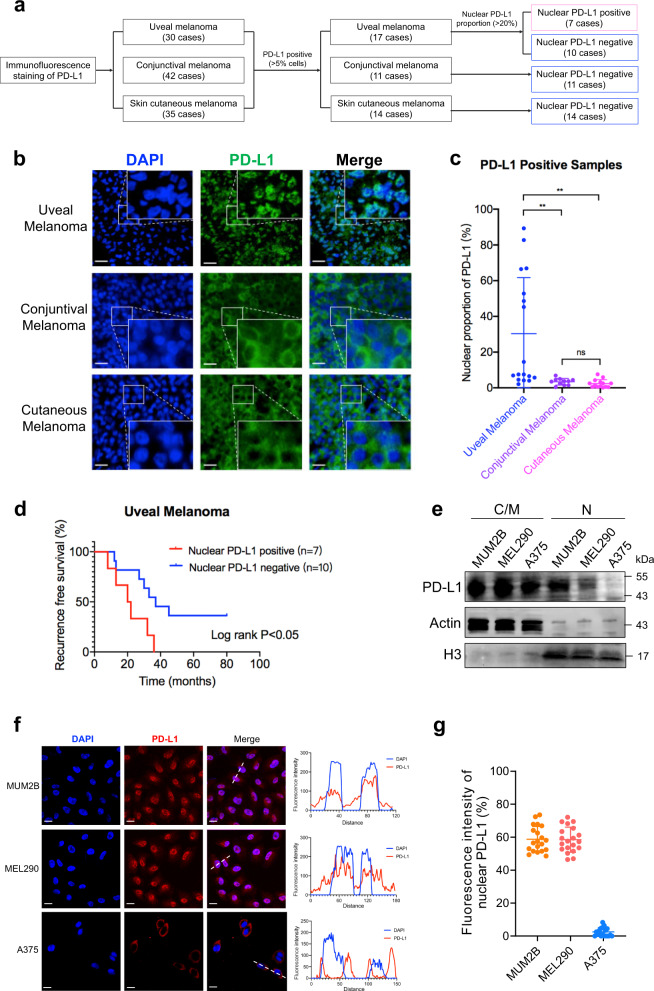
Fig. 1. Elevated nuclear proportion of PD-L1 in UM.
a Flow diagram for the identification of PD-L1 subcellular localization in different types of melanomas. b Representative images of IF staining of PD-L1 in UM, CoM and SKCM samples. Scale bars, 25 µm. c Statistical results of the nPD-L1 proportion in UM, CoM and SKCM samples. Data are presented as means ± SD. Two-tailed unpaired Student’s t-tests. d Kaplan–Meier analysis of the recurrence-free survival of nPD-L1-positive and -negative patients. A log-rank test was used to determine the statistical significance between the nPD-L1-positive group (n = 7) and the nPD-L1-negative group (n = 10). e Western blot analysis of cytoplasmic/membrane (C/M) and nuclear (N) fractions of PD-L1 in different types of melanoma cell lines. f IF staining of PD-L1 in different types of melanoma cell lines. Left panel, representative IF staining images. Scale bars, 10 µm. Right panel, colocalization analysis of PD-L1 and DAPI by ImageJ software. g Statistical analysis of nPD-L1 fluorescence intensity (%) in Fig. 1f. n = 20. Data are presented as the means ± SD. Two-tailed unpaired Student’s t-tests.

