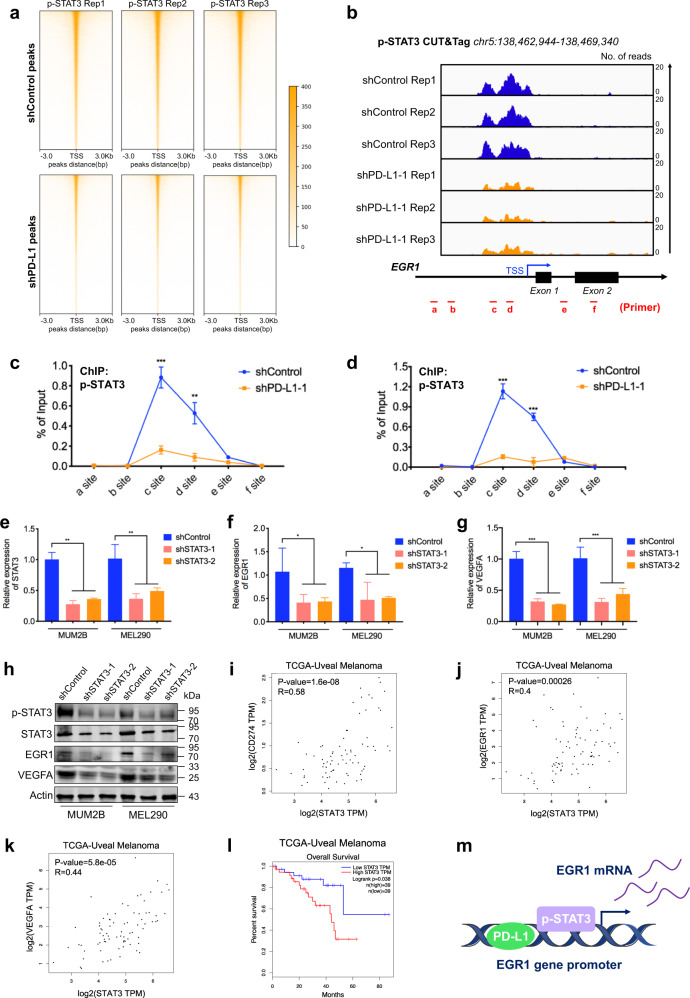
Fig. 5. Nuclear PD-L1 promotes transcriptional activation of EGR1 by p-STAT3.
a CUT&Tag density heatmap of p-STAT3 enrichment in PD-L1-silenced cells and control cells within 3 kb around TSS. b IGV tracks for EGR1 from p-STAT3 CUT&Tag analysis of PD-L1-silenced cells and control cells. c, d ChIP–qPCR assay of the p-STAT3 status at the EGR1 promoter and its upstream and downstream regions after PD-L1 silencing in MUM2B (c) and MEL290 (d) cells. e–g RT-PCR detection of relative STAT3 (e), EGR1 (f) and VEGFA (g) mRNA expression in MUM2B and MEL290 cells after STAT3 knockdown. n = 3. Data are presented as means ± SD. Two-tailed unpaired Student’s t-test. h Western blot images showing the protein levels of p-STAT3, STAT3, EGR1 and VEGFA in STAT3-silenced cells and control cells. i–k Gene expression correlation analysis of STAT3 and PD-L1 (i), STAT3 and EGR1 (j), STAT3 and VEGFA (k) in UM patients using TCGA database. l Kaplan-Meier analysis of the overall survival of UM patients with low and high STAT3 expression levels using TCGA database. m Schematic diagram showing that nPD-L1 and p-STAT3 coactivated EGR1 transcription in UM.

