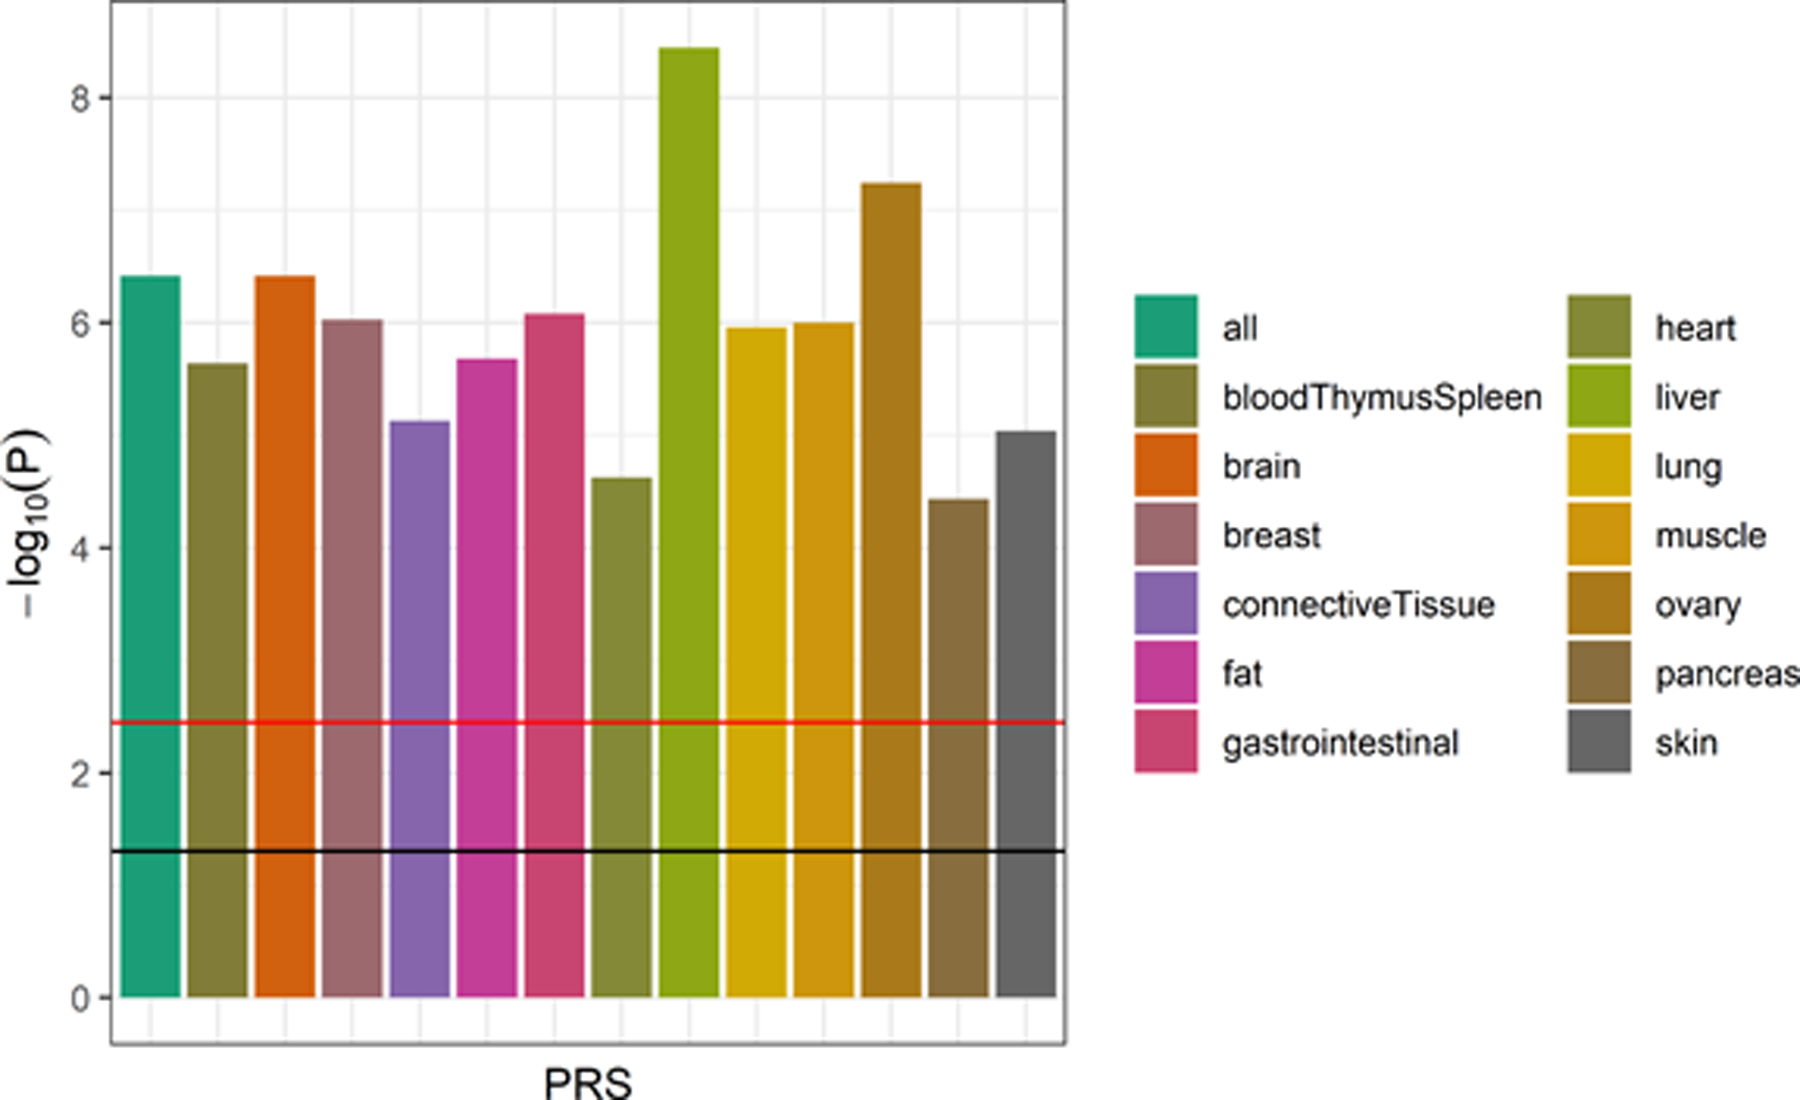
Figure 1. Association of tissue-specific PRS with AD diagnosis (APOE included).

The strength of association of each PRS (with the APOE locus included) with AD diagnosis (relative to cognitively unimpaired participants; MCI cases excluded) from the logistic regression models is shown (n = 1,115). The horizontal lines indicate thresholds for significance, with the black line indicating the nominal threshold of P = 0.05 and the red line indicating the Bonferroni-corrected threshold of P = 0.0036. All PRS scores were statistically significantly associated with AD diagnosis, with the liver PRS being the most strongly associated score.
