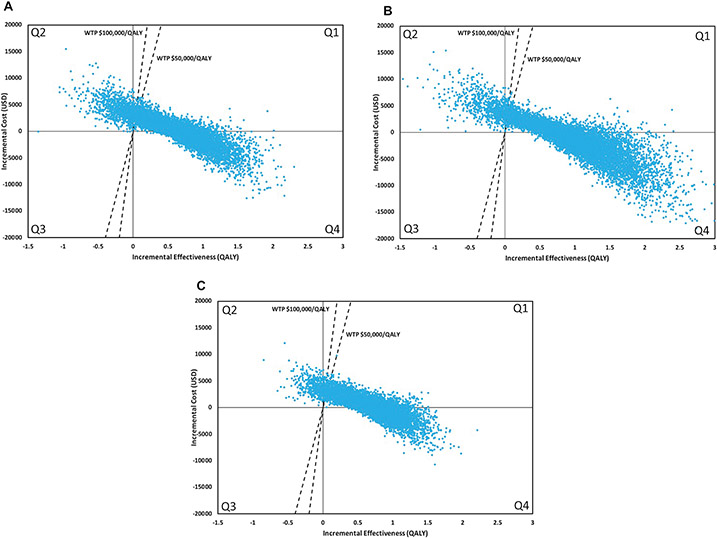
Figure 2.
Incremental cost-effectiveness scatterplot of smoking-cessation intervention with brief counseling versus brief counseling alone for the payer perspective. Each scatterplot includes a set of points representing pairs of incremental cost and effectiveness values from the simulation results (n=10,000). The comparator is brief counseling alone. The dashed line is the WTP threshold. Each scatterplot is divided into four quadrants. Points in Q1 indicate the intervention is more costly and more effective. Points in this quadrant below the WTP threshold are cost-effective and points above the willingness-to-pay threshold are not cost-effective. Points in Q2 indicate the intervention is more costly and less effective. Points in Q3 indicate the intervention is less costly and less effective. Points in Q4 indicate the intervention is less costly and more effective (dominant strategy). A. Varenicline B. Any pharmacotherapy with intensive counseling C. Monetary incentives. Abbreviations: WTP, willingness-to-pay; QALY, quality-adjusted life year.

