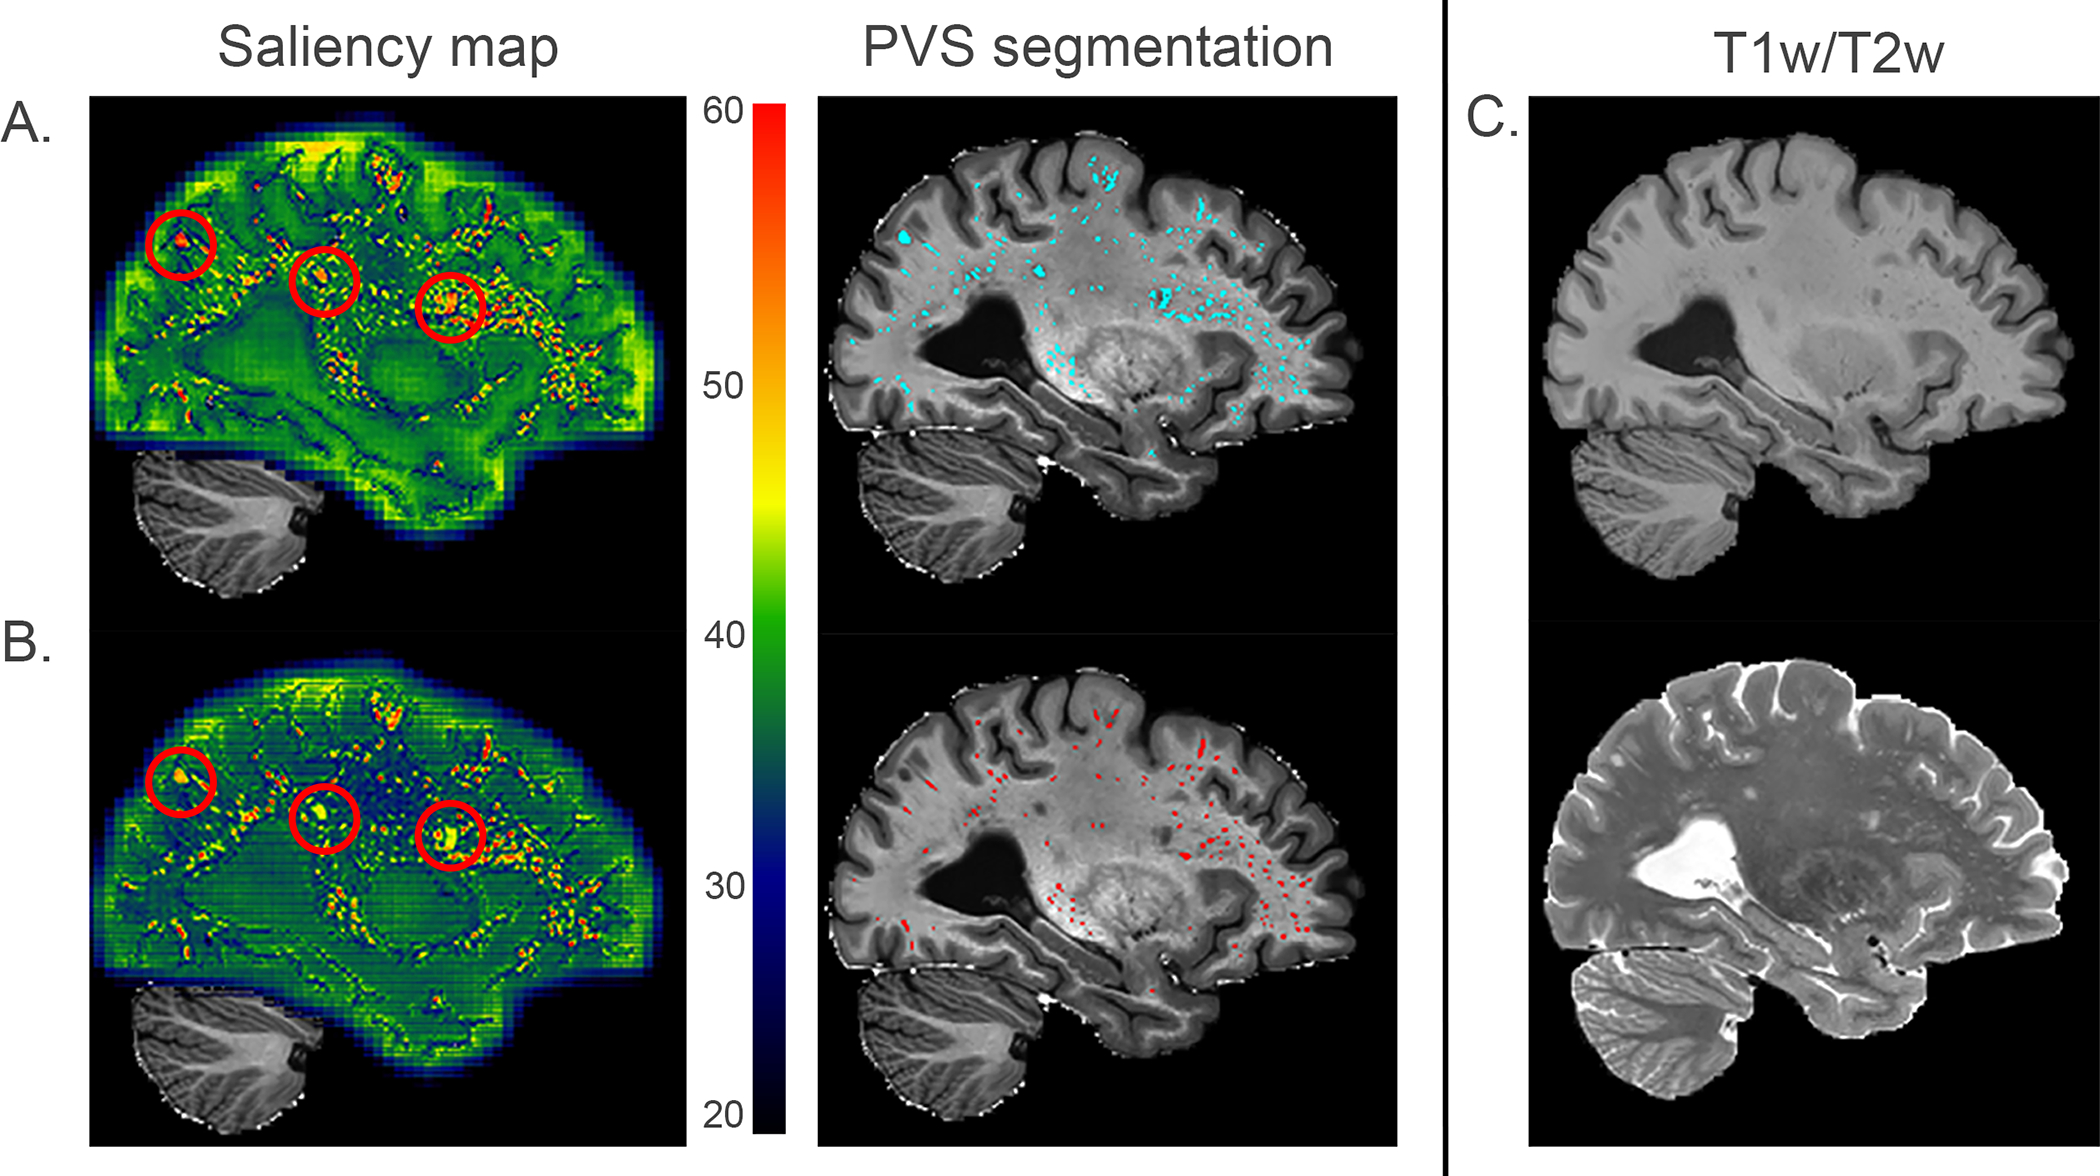
Figure 4. Saliency maps of WPSS models trained without supervision and with supervision using QC data.

A. presents the saliency map of results generated by WPSS trained in weak supervision and PVS segmentation results (cyan color) overlayed on EPC. Segmented PVS map has false positive rate = 0.0129, precision = 0.665, *recall = 0.97, Fβ score (β=0.5) = 0.666. B. presents the saliency map of results generated by WPSS trained with QC data supervision and PVS segmentation results (red color) overlayed on EPC. Segmented PVS map has false positive rate = 0.0032, precision = 0.818, *recall = 0.684, Fβ score (β=0.5) = 0.787. C. from top to bottom corresponding T1w and T2w modalities are presented. Because the QC effort was performed by only focusing on correcting false positive segmentations for Frangi filter results, recall is not a valid evaluation metric to use for the model performance, which is why it is marked as *recall.
