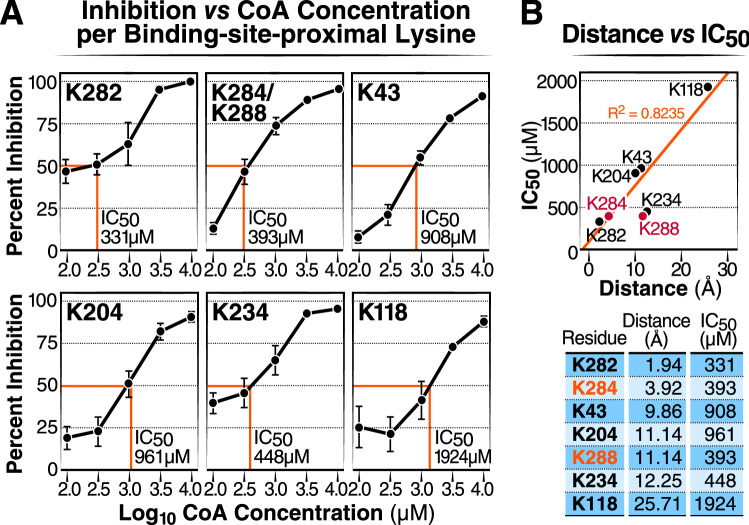
Figure 6.
CoA inhibition at a particular lysine site is inversely correlated with the distance to the CoA-binding pocket. (a) Inhibition curve and per-residue IC50 for CoA inhibiting the succinylation of individual lysine residues on ECHS1. ECHS1 was incubated with succinyl-CoA and increasing concentrations of CoA. Dose–response curves were expressed as the log of CoA concentration versus SuK inhibition. Percent inhibition for each residue was calculated by measuring the percent change between succinylation levels when ECHS1 was co-incubated with succinyl-CoA in the presence and absence of CoA treatment for 45 min. N = 4 per treatment. (b) Plot showing the correlative relationship between lysine residue distances vs the IC50 (μM) (N = 5, R2 = 0.8235). In the MS analysis, succinylation levels for K284 and K288 were combined as both residues were exclusively found on a shared peptide after trypsinization. As a result, these sites were not used to generate the R2 value or trendline and are included in the graph as red points.

