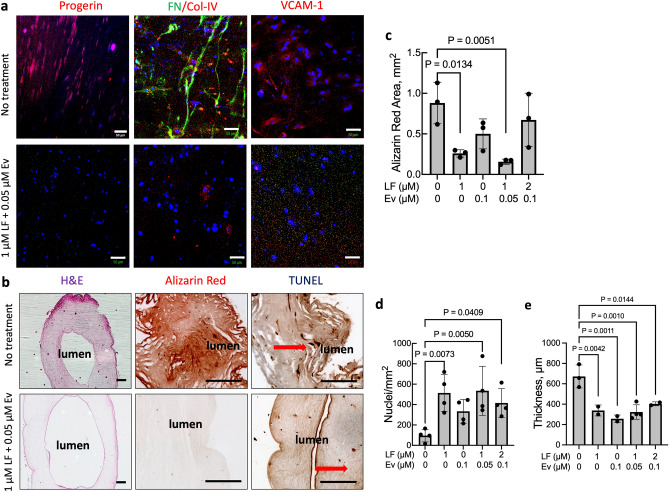
Figure 6.
Lonafarnib and Everolimus treatment mitigates HGPS TEBV pathology. Representative immunofluorescence images of (a) progerin, fibronectin (FN), collagen IV (Col-IV), vascular cell adhesion molecule-1 (VCAM-1), and (b) H&E staining, alizarin red staining, and TUNEL staining in HGPS 167 CL2 TEBVs matured for 3 weeks then treated with 1 µM Lonafarnib (LF) + 0.05 µM Everolimus (Ev) for 1 week. Scale bar 50 µm for progerin, FN/Col-IV, and VCAM-1, and 200 µm for H&E, alizarin red, and TUNEL. (c) Quantification of alizarin red-positive area in untreated and treated HGPS 167 Cl2 TEBVs. (d) Nuclei density and (e) TEBV thickness in untreated and treated HGPS 167 CL2 TEBVs. Data presented as mean ± SD. N = 3 TEBVs per group for alizarin red and 4 TEBVs per group for cell density. *p < 0.05, **p < 0.01 compared with untreated case. Representative images for the 1 µM Lonafarnib treatment, 0.1 µM Everolimus treatment, and 2 µM Lonafarnib + 0.1 µM Everolimus treatment conditions are shown in Figs. S12 and S13.

