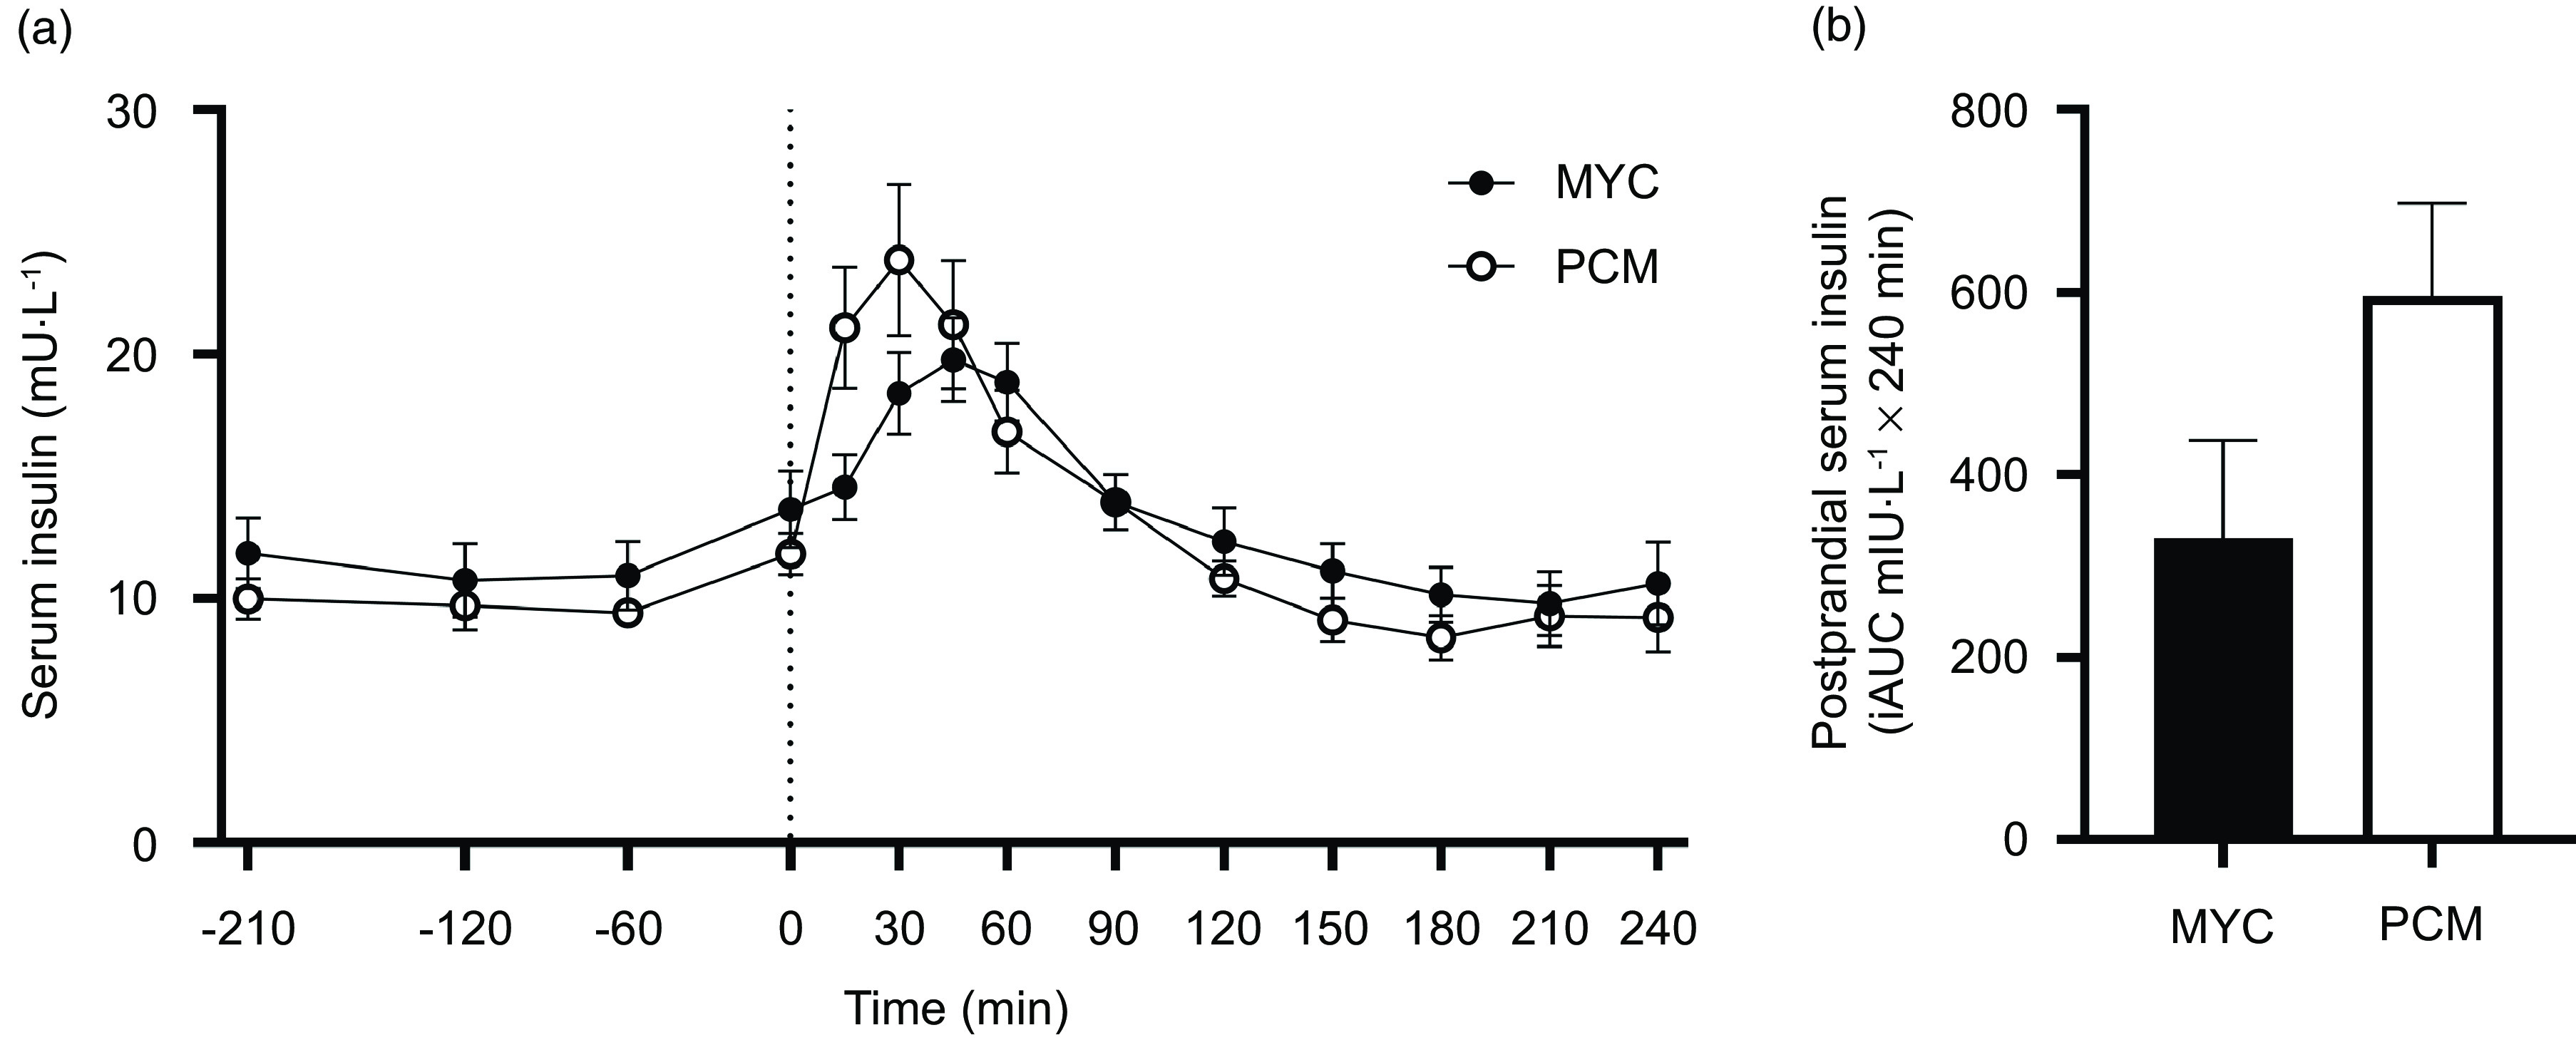
Fig. 2.

Time course (a) and incremental AUC (iAUC; calculated as above postaborptive values) (b) of serum insulin concentrations for a 3·5 h postabsorptive period (time course only) and a 4 h postprandial period in healthy resistance-trained men. The dashed vertical line represents drink consumption (70 g of mycoprotein containing 31·5 g protein and 2·5 g leucine (MYC; n 12) or 38·2 g of protein concentrated from mycoprotein containing 28·0 g protein and 2·5 g leucine (PCM; n 12)), and execution of a bout of unilateral resistance leg exercise. Time course data were analysed using a two-way repeated-measures ANOVA (group × time) with Sidak post hoc tests used to detect differences at individual time points. iAUC data were analysed using an independent-samples t test. Time × group interaction; P < 0·001. Values are mean ± sem.
