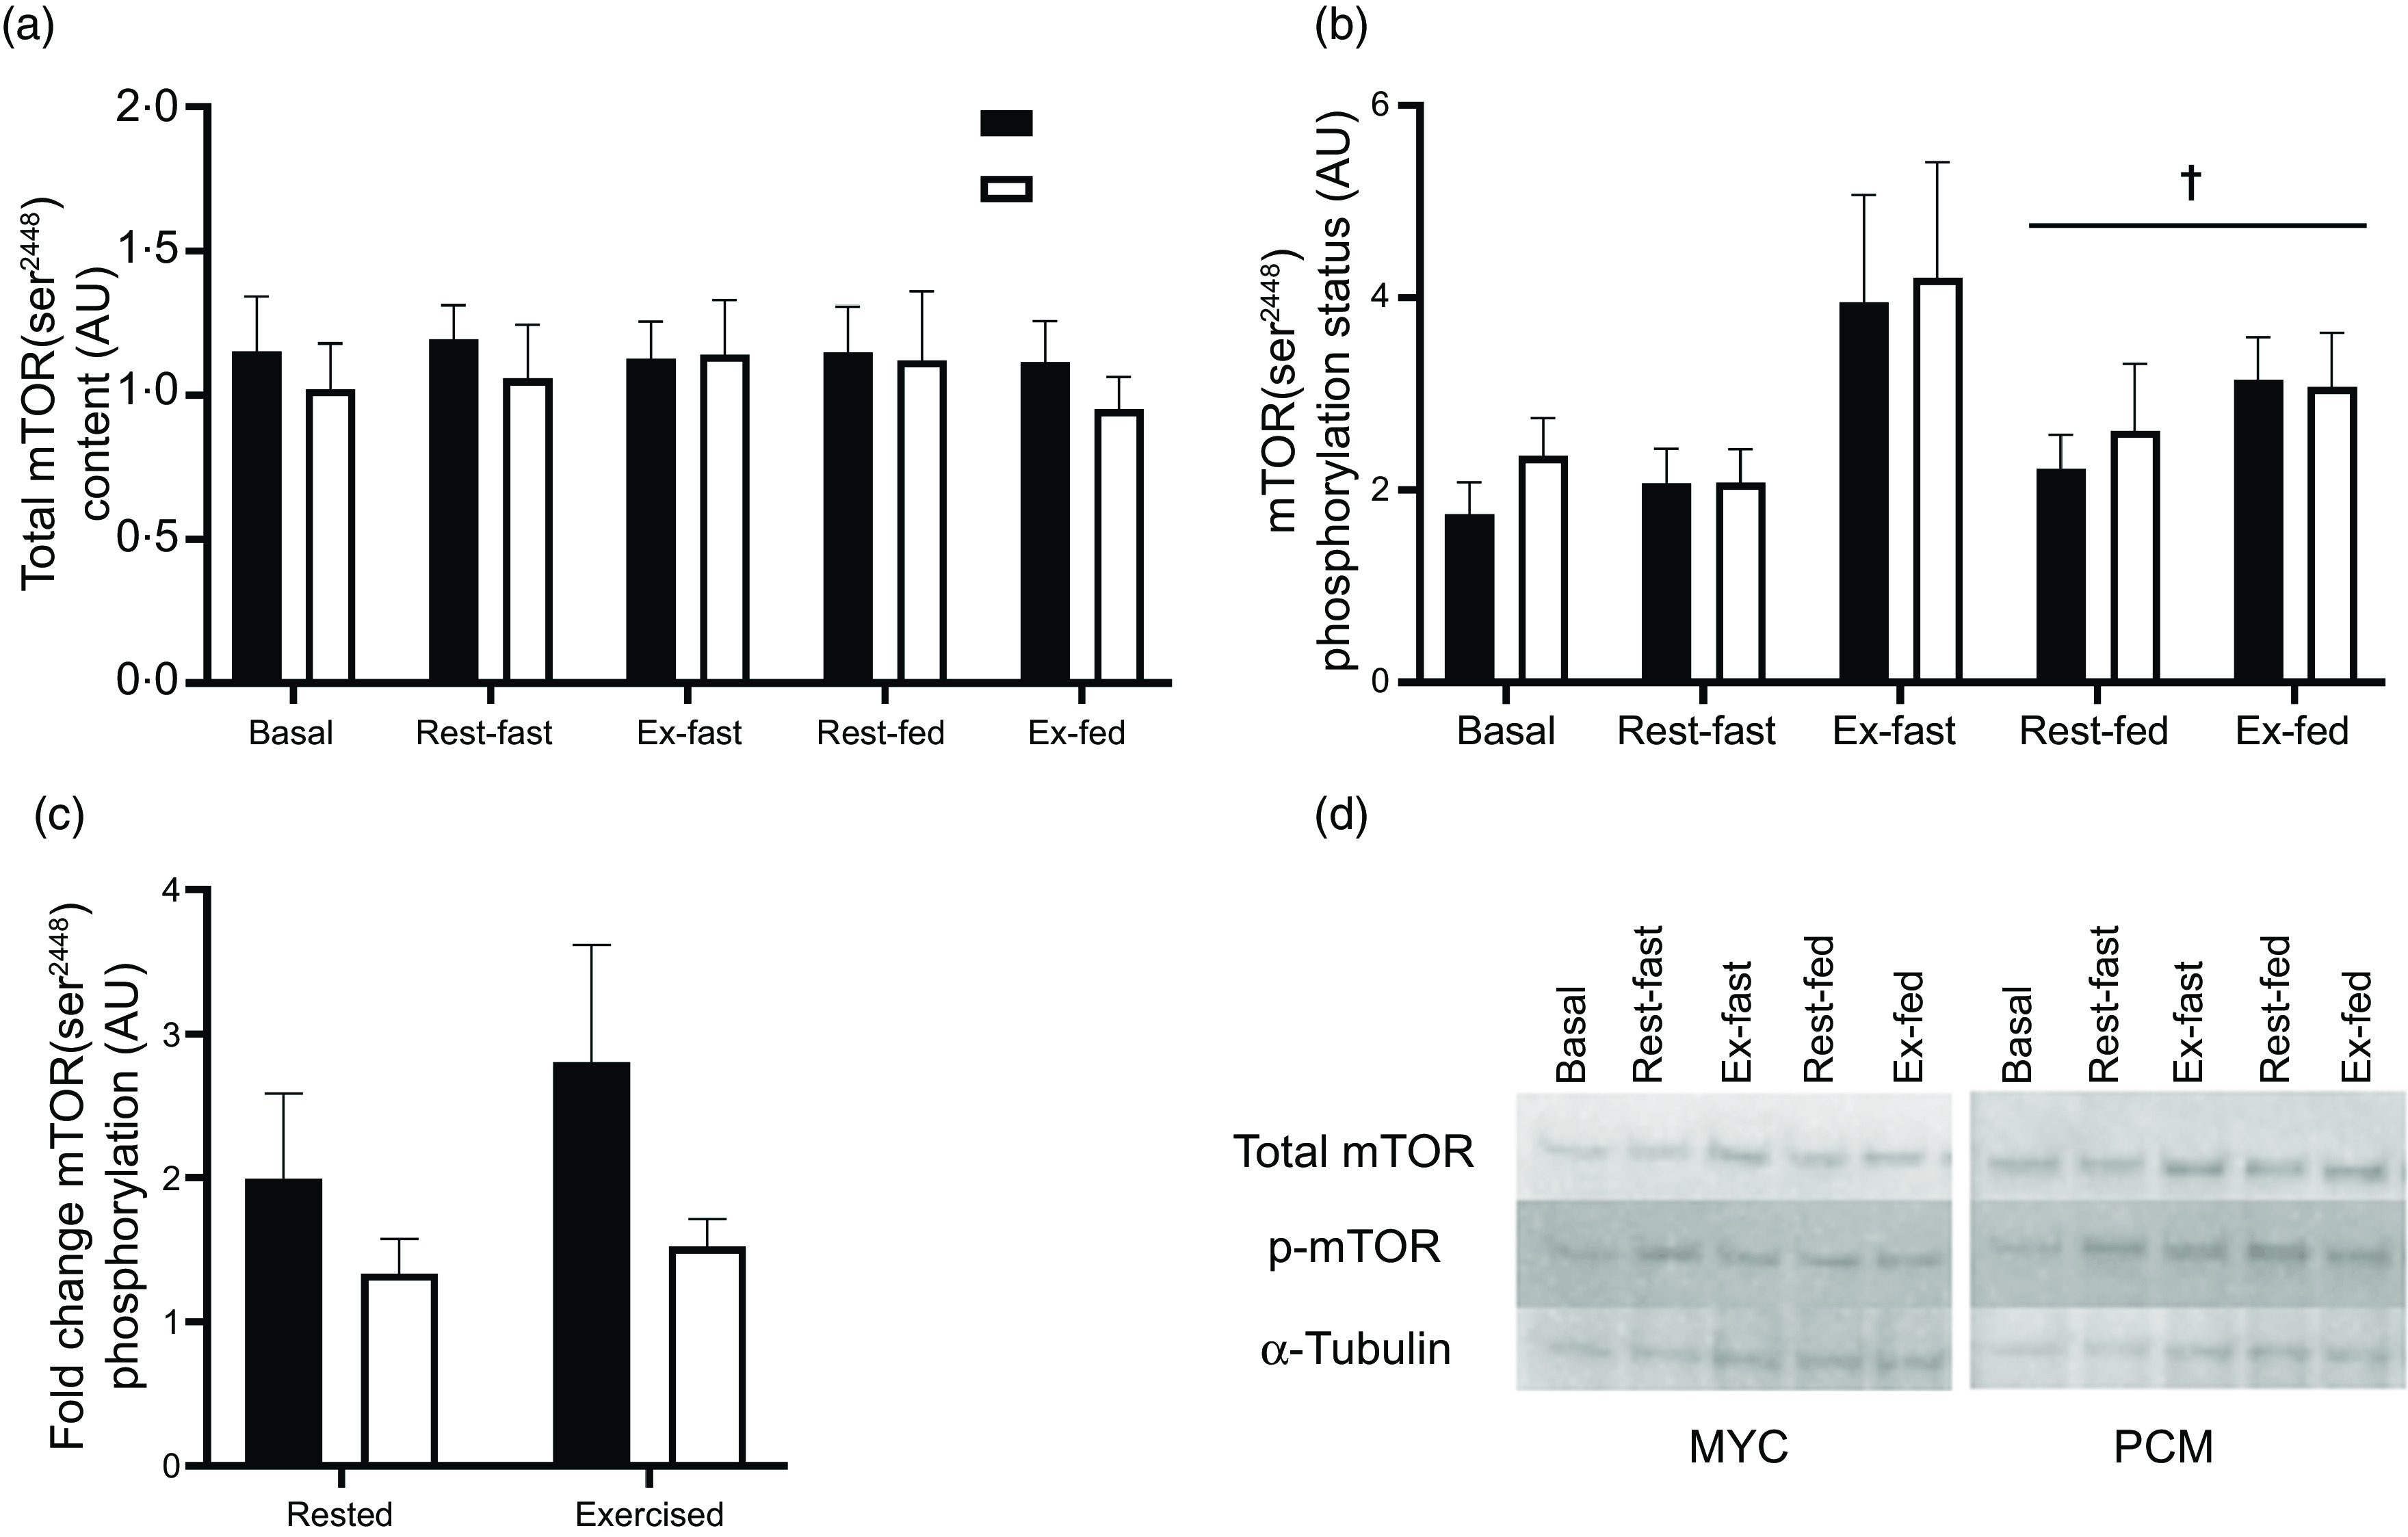
Fig. 7.

Total skeletal muscle mTOR content (a), muscle mTOR phosphorylation status (as a ratio of phosphorylated to total protein) (b), mTOR phosphorylation status (as a ratio of phosphorylated to total protein) fold change from basal to postprandial conditions in rested and exercised muscle tissue (c), and representative blots (d) for both groups. Basal bars represent total and phosphorylation status of mTOR before exercise and protein ingestion. Fasted bars represent total and phosphorylation status of mTOR immediately following exercise in the rested (rested fasted) and exercised (exercise fasted) legs. Fasted data points were excluded from the statistical analysis as the primary interest in the study is investigating change from basal to fed conditions. Postprandial bars (rested fed and exercise fed) represent total and phosphorylation status of mTOR 4 h following drink consumption (70 g of mycoprotein containing 31·5 g protein and 2·5 g leucine (MYC; n 12) or 38·2 g of protein concentrated from mycoprotein containing 28·0 g protein and 2·5 g leucine (PCM; n 12)), and execution of a bout of unilateral resistance leg exercise. Data were analysed using a three-way (time × group × exercise) ANOVA. Fold change data were analysed using a two-way ANOVA (group × exercise). All interactions and main effects for total skeletal muscle mTOR content (P > 0·05). Significant effect of feeding on mTOR phosphorylation status (time effect P < 0·05). All interactions and main effects for mTOR phosphorylation status fold change (P > 0·05). † A significant difference from basal condition (P < 0·01). Values are mean ± sem. mTOR, mammalian target of a rapamycin.
