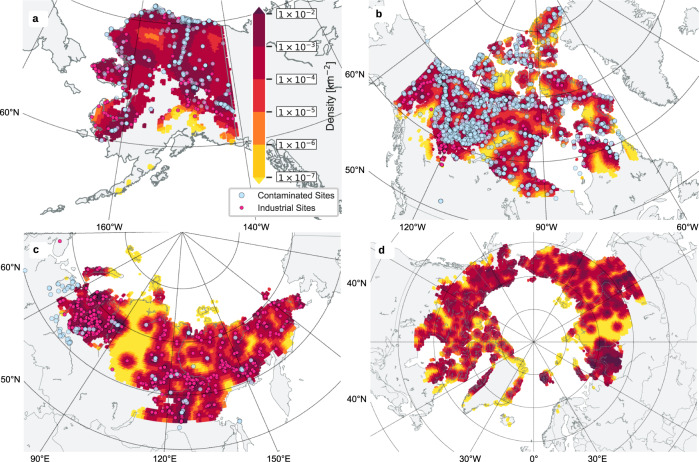
Fig. 5. Projected densities of contaminated sites in Arctic permafrost dominated regions.
The density maps of contaminated sites per area as derived by the point process models for a Alaska and b Canada with dots depicting the locations of industrial and contaminated sites. Map c shows the predicted density of contaminated sites for the permafrost dominated region in Russia with dots showing the data on contaminated sites surveyed in this study and that are used for model validation. Applying the model to the entire permafrost model domain yields a pan-Arctic map of estimated contaminated site density d. Note that the speckled appearance results from the regional clustering of industrial sites combined with the chosen bandwidth (50 × 50 km) of the gaussian density filter used for the point process models. Map generated with Python using the Basemap Matplotlib library and the GSHHG dataset59.

