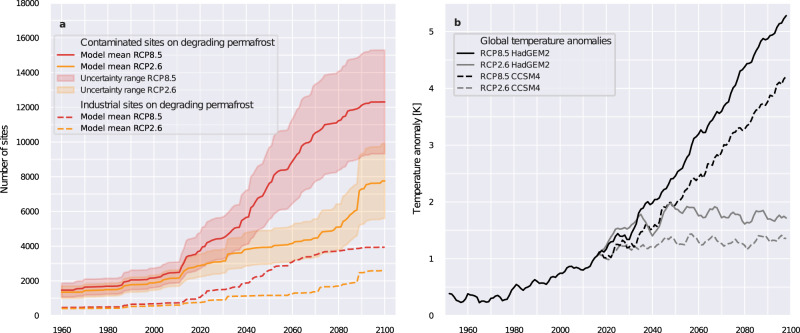
Fig. 6. Industrial and contaminated sites affected by permafrost thaw under global warming conditions.
a Number of industrial sites and number of upscaled contaminated sites located in the permafrost dominated region modeled to be affected by permafrost thaw based on RCP 2.6 and RCP 8.5 warming scenarios (model mean from the CMIP5 projections based on CCSM4 and HADGEM2-ES). The shaded areas show the uncertainty range due to the spatial extrapolations based on the two point process models (PPM1 and PPM2). b The related global temperature increase is shown as an anomaly compared to the pre-industrial period (1850–1900).

